Difference between revisions of "TUFLOW Viewer - Map Outputs - Plotting Flow"
Chris Huxley (talk | contribs) |
|||
| (4 intermediate revisions by 2 users not shown) | |||
| Line 1: | Line 1: | ||
| − | |||
| − | |||
===Tool Description=== | ===Tool Description=== | ||
This tool extracts flow time series across a polyline from the map outputs. For 3D map outputs, the tool will use the current 3D to 2D depth average rendering method. The tool uses depth, velocity magnitude, and velocity direction to calculate the flux. Positive flow convention for the line is left to right looking downstream.<br> | This tool extracts flow time series across a polyline from the map outputs. For 3D map outputs, the tool will use the current 3D to 2D depth average rendering method. The tool uses depth, velocity magnitude, and velocity direction to calculate the flux. Positive flow convention for the line is left to right looking downstream.<br> | ||
| − | '''<span style="color:#FF0000">IMPORTANT:</span>''' In most cases this tool should be used for flow approximation only. The tool uses map outputs to estimate flow across a line; it uses depth, velocity magnitude, and velocity direction. Map outputs unfortunately do not include all required information such as cell blockage or flow regime (e.g. in TUFLOW this could be super critical flow or weir flow). For models using sub-grid sampling, the estimated flow could significantly misrepresent the flow. It is recommended that PO lines (2d_PO) be used to calculate flow, especially where accurate estimates are required. This tool will always use the rendered 2D depth averaged results and therefore not appropriate for 3D results.<br> | + | '''<span style="color:#FF0000">IMPORTANT:</span>''' In most cases this tool should be used for flow approximation only. The tool uses map outputs to estimate flow across a line; it uses depth, velocity magnitude, and velocity direction. Map outputs unfortunately do not include all required information such as cell blockage or flow regime (e.g. in TUFLOW this could be super critical flow or weir flow). For models using sub-grid sampling, the estimated flow could significantly misrepresent the flow. It is recommended that PO lines (2d_PO) be used to calculate flow, especially where accurate estimates are required. This tool will always use the rendered 2D depth averaged results and therefore is not appropriate for 3D results.<br> |
Since version 3.1.0 TUFLOW Viewer will calculate mesh intersections with the plotting line and use mid-way points to extract mesh information. This was done to improve extraction from flexible mesh results (e.g. Quadtree and FV).<br> | Since version 3.1.0 TUFLOW Viewer will calculate mesh intersections with the plotting line and use mid-way points to extract mesh information. This was done to improve extraction from flexible mesh results (e.g. Quadtree and FV).<br> | ||
| Line 12: | Line 10: | ||
To use the tool: | To use the tool: | ||
<ol> | <ol> | ||
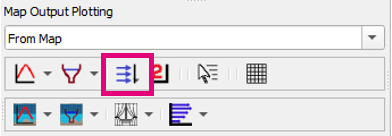
| − | <li> Click the flux icon so that it becomes indented and the cursor changes to a crosshair | + | <li> Click the flux icon so that it becomes indented and the cursor changes to a crosshair.<br> |
| + | [[File: Plotting_Toolbar_Flux.PNG]]<br> | ||
<li> Left click in the QGIS map window to start drawing a line. Left click to add vertices to the polyline. | <li> Left click in the QGIS map window to start drawing a line. Left click to add vertices to the polyline. | ||
| − | <li> Right click to finish drawing your line (note: line must contain at least 2 vertices and right clicking does not add a vertex) | + | <li> Right click to finish drawing your line (note: line must contain at least 2 vertices and right clicking does not add a vertex). |
</ol> | </ol> | ||
| − | === | + | ===Example=== |
[[file: Plotting_MapOutput_Flow.gif]] | [[file: Plotting_MapOutput_Flow.gif]] | ||
| − | + | <br><br> | |
| − | |||
| − | |||
| − | |||
| − | |||
| − | |||
| − | |||
| − | |||
| − | |||
| − | |||
| − | |||
| − | |||
| − | |||
| − | |||
| − | |||
| − | |||
| − | |||
| − | |||
| − | |||
| − | |||
| − | |||
| − | |||
| − | |||
{{Tips Navigation | {{Tips Navigation | ||
| − | |uplink=[[TUFLOW_Viewer# | + | |uplink=[[TUFLOW_Viewer#Map_Output| Back to TUFLOW Viewer Main Page]] |
}} | }} | ||
Latest revision as of 14:57, 2 June 2021
Tool Description
This tool extracts flow time series across a polyline from the map outputs. For 3D map outputs, the tool will use the current 3D to 2D depth average rendering method. The tool uses depth, velocity magnitude, and velocity direction to calculate the flux. Positive flow convention for the line is left to right looking downstream.
IMPORTANT: In most cases this tool should be used for flow approximation only. The tool uses map outputs to estimate flow across a line; it uses depth, velocity magnitude, and velocity direction. Map outputs unfortunately do not include all required information such as cell blockage or flow regime (e.g. in TUFLOW this could be super critical flow or weir flow). For models using sub-grid sampling, the estimated flow could significantly misrepresent the flow. It is recommended that PO lines (2d_PO) be used to calculate flow, especially where accurate estimates are required. This tool will always use the rendered 2D depth averaged results and therefore is not appropriate for 3D results.
Since version 3.1.0 TUFLOW Viewer will calculate mesh intersections with the plotting line and use mid-way points to extract mesh information. This was done to improve extraction from flexible mesh results (e.g. Quadtree and FV).
Note: some mesh results store information on the mesh face as opposed to the mesh vertices (mesh face in this context refers to the cell area as opposed to the mesh sides) and TUFLOW Viewer will use the raw mesh face results and not the resampled vertex information. An example of a result dataset that stores results on the mesh face is TUFLOW FV NetCDF map outputs.
Users can view the intersection points (and faces if applicable) by toggling on Mesh Intercept Locations in Settings >> Options >> Check / Debug. Prior to version 3.1.0, TUFLOW Viewer used a sampling distance which can be set in the options.
To use the tool:
- Click the flux icon so that it becomes indented and the cursor changes to a crosshair.
- Left click in the QGIS map window to start drawing a line. Left click to add vertices to the polyline.
- Right click to finish drawing your line (note: line must contain at least 2 vertices and right clicking does not add a vertex).

Example

| Up |
|---|