Difference between revisions of "TUFLOW Viewer - Showing Selected Elements And Selecting Sub-Sets"
Jump to navigation
Jump to search
Ellis Symons (talk | contribs) (Created page with "===Tool Description=== ===Examples=== ===Links=== ====Similar Tools==== * Load Results * TUFLOW_Viewer_-_Load_Results_-_Map_Outputs | Load...") |
Chris Huxley (talk | contribs) |
||
| (5 intermediate revisions by 3 users not shown) | |||
| Line 1: | Line 1: | ||
===Tool Description=== | ===Tool Description=== | ||
| − | + | It's possible to view all the selected elements (e.g. all selected 1D pipes) and then use that list to select a sub-set and easily switch between the selection based on the name. This can be useful when viewing 1D time series results for either large pipe networks or open channels.<br> | |
| − | |||
| − | |||
| − | |||
| − | |||
| − | |||
| − | === | + | To open and use the tool: |
| − | + | <ol> | |
| + | <li> '''Results >> Show Selected Elements'''<br> | ||
| + | [[File: Plotting_Show_Selected_Elements_Menu.PNG]] | ||
| + | <li> Select desired sub-set and select '''Select Elements on Map'''<br> | ||
| + | [[File: Plotting_Show_Selected_Elements_Dialog.PNG]] | ||
| + | <li> The result will be the chosen elements will be selected in the QGIS map window and the plot will be updated to only show the chosen elements. | ||
| + | <li> The dialog will remain open and the user can update the selected sub-set as often as they want | ||
| + | </ol> | ||
| + | ===Example=== | ||
| + | [[File: Plotting_Show_Selected_Elements_Example.gif]] | ||
| + | <br><br> | ||
| + | |||
| + | {{Tips Navigation | ||
| + | |uplink=[[TUFLOW_Viewer#Time_Series_Output| Back to TUFLOW Viewer Main Page]] | ||
| + | }} | ||
Latest revision as of 14:45, 2 June 2021
Tool Description
It's possible to view all the selected elements (e.g. all selected 1D pipes) and then use that list to select a sub-set and easily switch between the selection based on the name. This can be useful when viewing 1D time series results for either large pipe networks or open channels.
To open and use the tool:
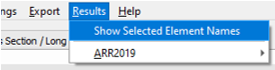
- Results >> Show Selected Elements
- Select desired sub-set and select Select Elements on Map
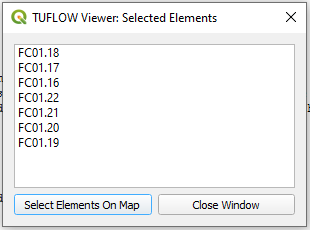
- The result will be the chosen elements will be selected in the QGIS map window and the plot will be updated to only show the chosen elements.
- The dialog will remain open and the user can update the selected sub-set as often as they want


Example

| Up |
|---|