Difference between revisions of "TUFLOW Viewer - Showing The Current Time"
Jump to navigation
Jump to search
Chris Huxley (talk | contribs) |
|||
| (One intermediate revision by the same user not shown) | |||
| Line 3: | Line 3: | ||
''Note: The cross-section and vertical profile plots are already temporal and are not affected by '''Show Current Time'''.'' | ''Note: The cross-section and vertical profile plots are already temporal and are not affected by '''Show Current Time'''.'' | ||
| − | === | + | ===Example=== |
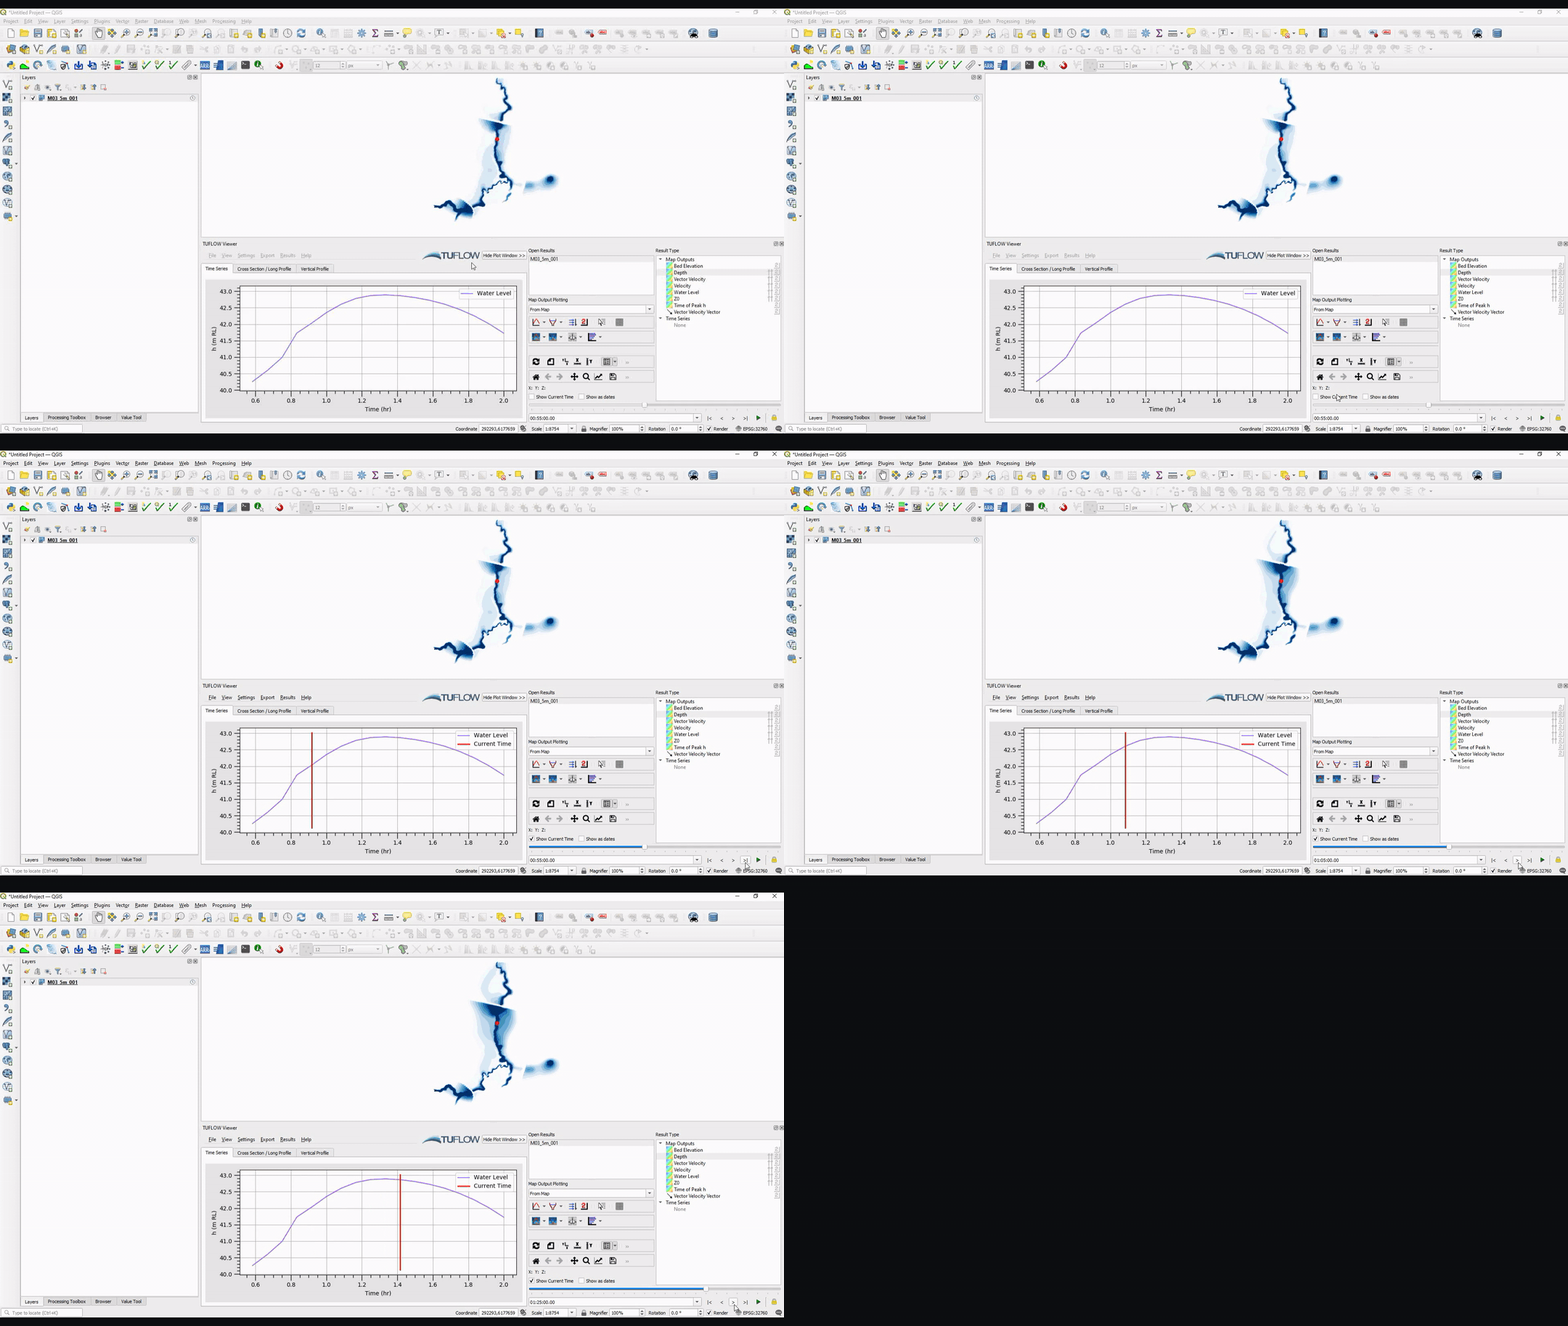
[[File: Plotting_Show_Current_Time_Example.gif]] | [[File: Plotting_Show_Current_Time_Example.gif]] | ||
| − | + | <br><br> | |
| − | |||
| − | |||
| − | |||
| − | |||
| − | |||
| − | |||
| − | |||
| − | |||
| − | |||
| − | |||
| − | |||
| − | |||
| − | |||
| − | |||
{{Tips Navigation | {{Tips Navigation | ||
| − | |uplink=[[TUFLOW_Viewer# | + | |uplink=[[TUFLOW_Viewer#General_Plot_Display_Options| Back to TUFLOW Viewer Main Page]] |
}} | }} | ||
Latest revision as of 14:15, 2 June 2021
Tool Description
Showing the current time in the time series plot can be done by ticking on the Show Current Time checkbox above the time slider. This can be helpful to align the flood surface displayed in the map window and the time series plot.
Note: The cross-section and vertical profile plots are already temporal and are not affected by Show Current Time.
Example
| Up |
|---|
