TUFLOW Viewer - Time Series Outputs - Plotting Longitudinal Profiles
Revision as of 14:45, 2 June 2021 by Chris Huxley (talk | contribs)
Tool Description
Longitudinal profiles can be extracted from Time Series Outputs by following the steps below:
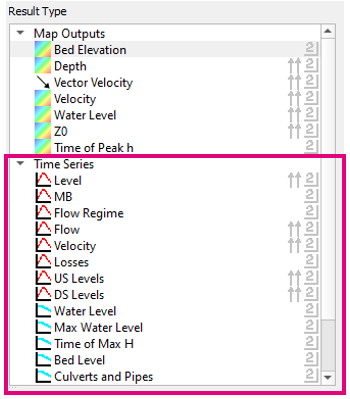
- Select a result type from the Time Series section - available long profile result types will have a long profile icon
 to the left.
- Select a feature from the _PLOT_L GIS layer:
- For ESTRY results - TUFLOW Viewer will automatically trace the network (pipe or open channel) downstream to the outlet. If a second feature is selected from the _PLOT_L GIS layer, the trace will be between the selected features. These features are required to be on the same profile or no profile will be displayed.
- For FM results - The user will be required to select all features to be plotted (no automatic trace is performed). Selected features that are not on the same profile as the original selection, or are not linked by selected features will be ignored.

To plot multiple result types, simply select multiple types in the Result Type panel.
Examples
ESTRY

FM

| Up |
|---|