Difference between revisions of "TUFLOW Viewer - Time Series Outputs GIS Data"
Chris Huxley (talk | contribs) (Created page with "==TUFLOW / ESTRY 2016 or Newer== From the 2016 TUFLOW release, time series outputs are written by TUFLOW into the 2D result location in a folder named "plot" ('''TUFLOW\result...") |
Chris Huxley (talk | contribs) |
||
| (6 intermediate revisions by the same user not shown) | |||
| Line 1: | Line 1: | ||
| + | The timeseries output GIS layers displayed in the QGIS Map Window will vary depending on the version of TUFLOW you are using | ||
| + | * TUFLOW 2016 or newer; | ||
| + | * TUFLOW 2013 or older; and | ||
| + | * TUFLOW linked to Flood Modeller 1D. | ||
| + | |||
==TUFLOW / ESTRY 2016 or Newer== | ==TUFLOW / ESTRY 2016 or Newer== | ||
| − | From the 2016 TUFLOW release, time series outputs are written by TUFLOW into the 2D result location in a folder named "plot" ('''TUFLOW\results\2D\plot'''). This folder consists of subfolders called "csv" and "gis" | + | From the 2016 TUFLOW release onwards, time series outputs are written by TUFLOW into the 2D result location in a folder named "plot" ('''TUFLOW\results\2D\plot'''). This folder consists of subfolders called "csv" and "gis". It also includeds a '''*.tpc''', the TUFLOW Plot Control file. TUFLOW View reads the TUFLOW Plot Control file to load the timeseries output results. This occurs automatically when a user loads results via: |
| − | + | *<u>'''[[TUFLOW_Viewer_-_Load_Results | Load All Results]]'''</u>; or | |
| − | * | + | *<u>'''[[TUFLOW_Viewer_-_Load_Results_-_Time_Series | Load Results - Time Series]]'''</u>. |
| − | * | ||
| − | |||
| − | |||
| − | + | Three vector files will be loaded: | |
| − | |||
| − | |||
<ol> | <ol> | ||
<li> _PLOT_P - point layer | <li> _PLOT_P - point layer | ||
| Line 15: | Line 15: | ||
<li> _PLOT_R - region (polygon) layer | <li> _PLOT_R - region (polygon) layer | ||
</ol> | </ol> | ||
| − | + | You will interact with these layers (select them in QGIS) to plot results from different elements. The layer you need to interact with will depend on the result type. For example, for the majority of instances, "water level" results will require the user to select point features in the _PLOT_P. Another example, plotting flow through a culvert will require the user to select the culvert feature in the _PLOT_L layer.<br> | |
===Example=== | ===Example=== | ||
[[File: TimeSeries_EstryResults.gif]] | [[File: TimeSeries_EstryResults.gif]] | ||
| − | + | <br><br> | |
| + | {{Tips Navigation | ||
| + | |uplink=[[TUFLOW_Viewer#Time_Series_Output| Back to TUFLOW Viewer Main Page]] | ||
| + | }} | ||
| + | <br><br> | ||
==TUFLOW / ESTRY 2013 or Older== | ==TUFLOW / ESTRY 2013 or Older== | ||
| − | If you have results from the 2013 TUFLOW release, you won't have the ability to load the '''*.tpc''' file as this was introduced in the 2016 TUFLOW release. TUFLOW Viewer does support time series results from the 2013 release, and is loaded from the '''*.info''' file in the 1D result folder in a subfolder called "csv". This | + | If you have results from the 2013 TUFLOW release, you won't have the ability to load the '''*.tpc''' file as this was introduced in the 2016 TUFLOW release. TUFLOW Viewer does hwoever still support time series results from the 2013 release, and is loaded from the '''*.info''' file in the 1D result folder in a subfolder called "csv". This is done when a user loads results via: |
| − | + | *<u>'''[[TUFLOW_Viewer_-_Load_Results | Load All Results]]'''</u>; or | |
| − | * | + | *<u>'''[[TUFLOW_Viewer_-_Load_Results_-_Time_Series | Load Results - Time Series]]'''</u>. |
| − | + | The '''*.info''' file contains referece information linkingthe GIS input files to the associated *.csv result files. In additon to the info file, to plot the results, you will need to open the relevant 1d_nwk GIS files and select features in QGIS. This differs from the '''*.tpc''' as this will output special GIS layers used for plotting and TUFLOW Viewer will open these automatically. These are also consolidated into three GIS files (depending solely on the geometry of the layer). Using the '''*.info''' approach, users will need to open all desired input files (which can be numerous for bigger models).<br> | |
| − | |||
| − | |||
| − | |||
| − | |||
===Example=== | ===Example=== | ||
[[File: TimeSeries_EstryResults2013.gif]] | [[File: TimeSeries_EstryResults2013.gif]] | ||
| + | <br><br> | ||
| + | {{Tips Navigation | ||
| + | |uplink=[[TUFLOW_Viewer#Time_Series_Output| Back to TUFLOW Viewer Main Page]] | ||
| + | }} | ||
| + | <br><br> | ||
==Flood Modeller== | ==Flood Modeller== | ||
| − | Flood Modeller time series results can be imported into TUFLOW Viewer using the "Load Results - Time Series FM" option. For more information on the files required, please see <u>[[TUFLOW_Viewer_-_Load_Results_-_Time_Series_FM | Load Results - Time Series FM]] | + | Flood Modeller time series results can be imported into TUFLOW Viewer using the "Load Results - Time Series FM" option. For more information on the files required, please see <u>'''[[TUFLOW_Viewer_-_Load_Results_-_Time_Series_FM | Load Results - Time Series FM]]'''</u>.<br> |
Key to the time series results are the GIS layers created when the user imports FM results. There will be two vector files: | Key to the time series results are the GIS layers created when the user imports FM results. There will be two vector files: | ||
Latest revision as of 16:34, 2 June 2021
The timeseries output GIS layers displayed in the QGIS Map Window will vary depending on the version of TUFLOW you are using
- TUFLOW 2016 or newer;
- TUFLOW 2013 or older; and
- TUFLOW linked to Flood Modeller 1D.
TUFLOW / ESTRY 2016 or Newer
From the 2016 TUFLOW release onwards, time series outputs are written by TUFLOW into the 2D result location in a folder named "plot" (TUFLOW\results\2D\plot). This folder consists of subfolders called "csv" and "gis". It also includeds a *.tpc, the TUFLOW Plot Control file. TUFLOW View reads the TUFLOW Plot Control file to load the timeseries output results. This occurs automatically when a user loads results via:
Three vector files will be loaded:
- _PLOT_P - point layer
- _PLOT_L - line layer
- _PLOT_R - region (polygon) layer
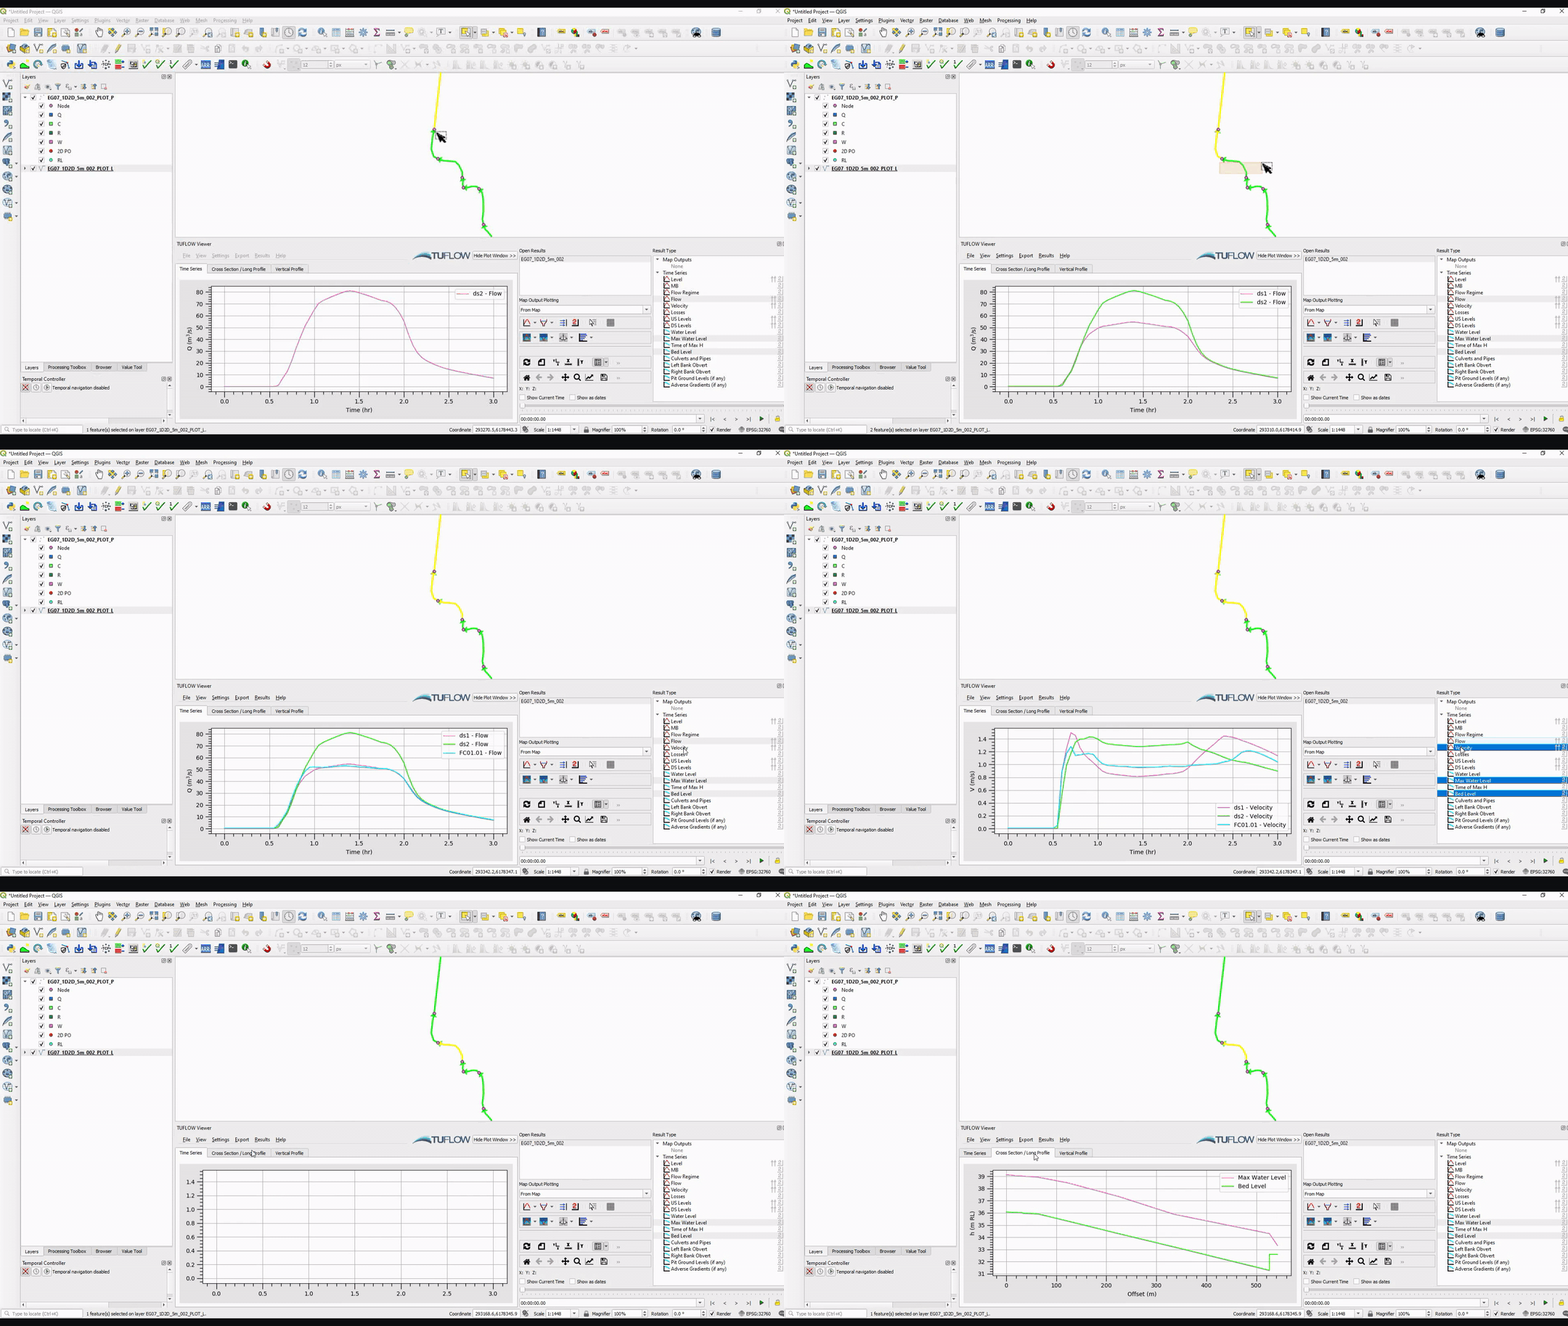
You will interact with these layers (select them in QGIS) to plot results from different elements. The layer you need to interact with will depend on the result type. For example, for the majority of instances, "water level" results will require the user to select point features in the _PLOT_P. Another example, plotting flow through a culvert will require the user to select the culvert feature in the _PLOT_L layer.
Example
| Up |
|---|
TUFLOW / ESTRY 2013 or Older
If you have results from the 2013 TUFLOW release, you won't have the ability to load the *.tpc file as this was introduced in the 2016 TUFLOW release. TUFLOW Viewer does hwoever still support time series results from the 2013 release, and is loaded from the *.info file in the 1D result folder in a subfolder called "csv". This is done when a user loads results via:
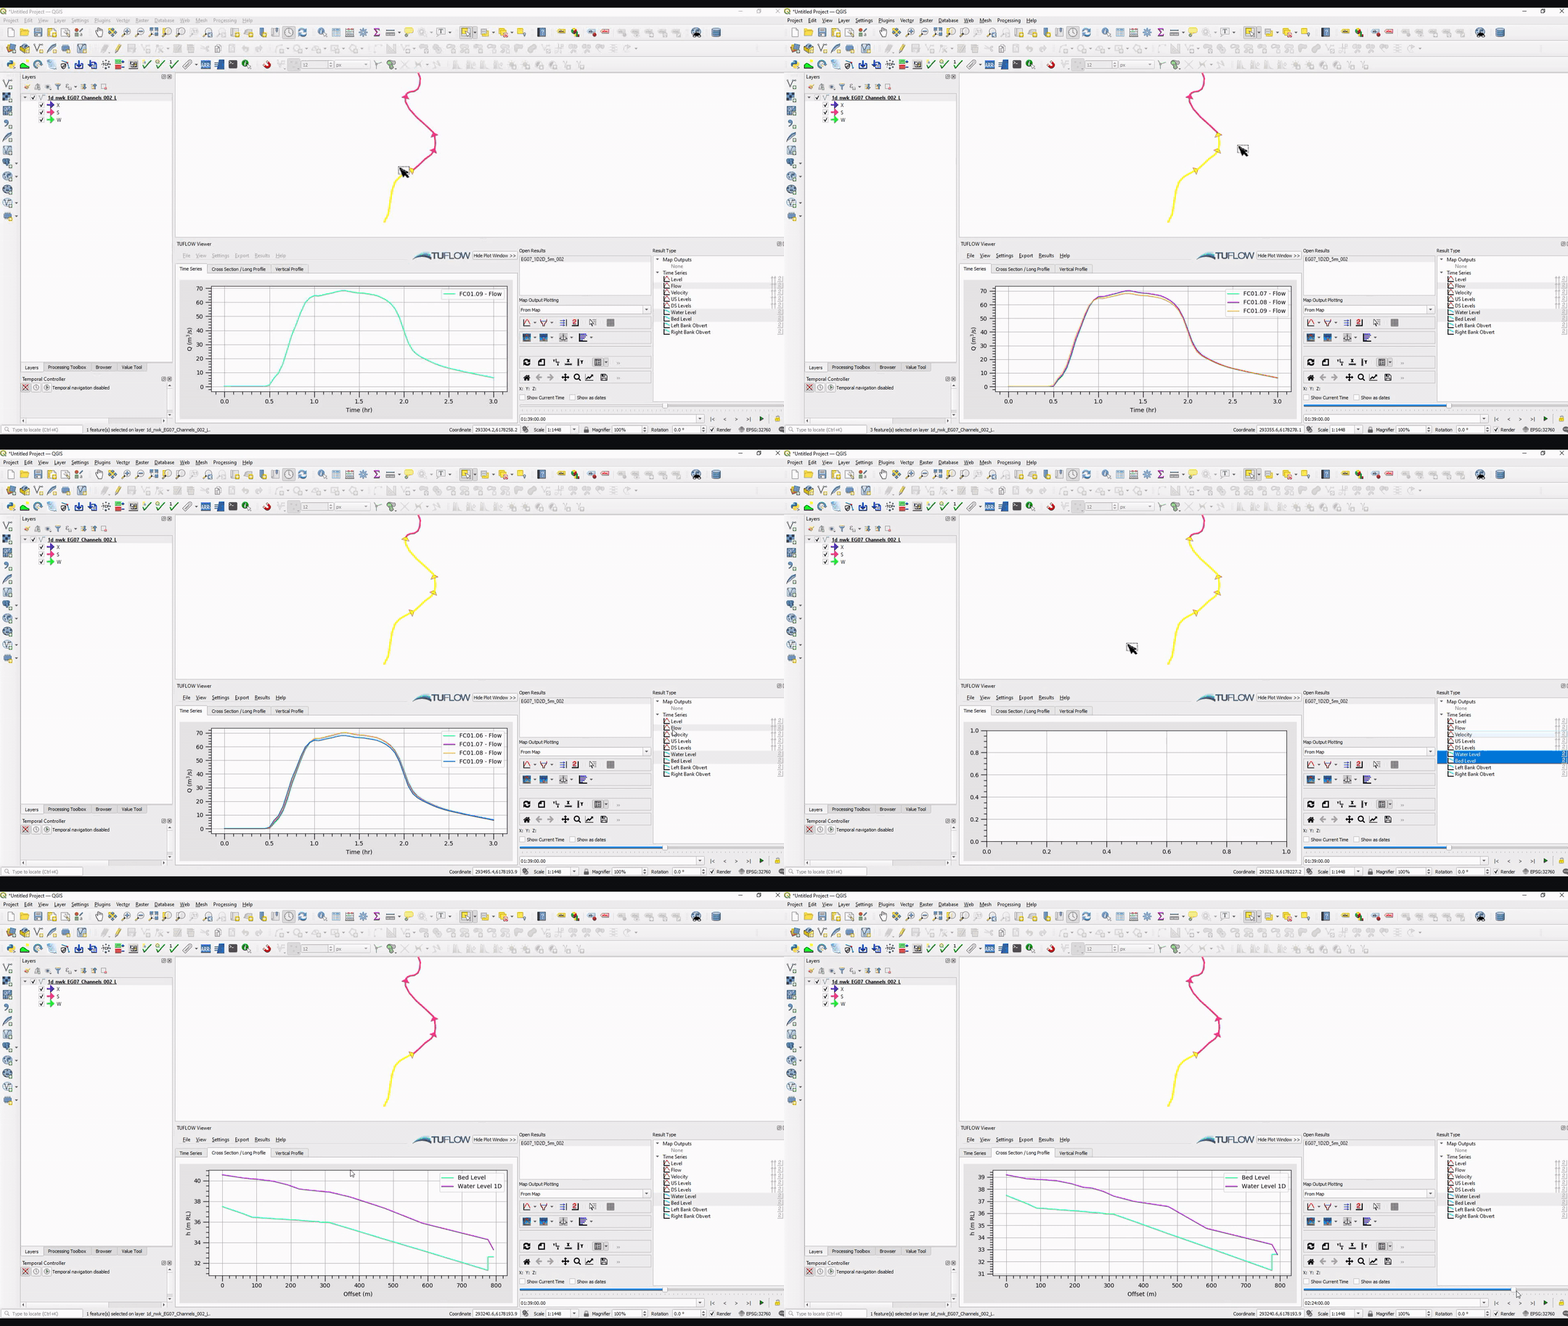
The *.info file contains referece information linkingthe GIS input files to the associated *.csv result files. In additon to the info file, to plot the results, you will need to open the relevant 1d_nwk GIS files and select features in QGIS. This differs from the *.tpc as this will output special GIS layers used for plotting and TUFLOW Viewer will open these automatically. These are also consolidated into three GIS files (depending solely on the geometry of the layer). Using the *.info approach, users will need to open all desired input files (which can be numerous for bigger models).
Example
| Up |
|---|
Flood Modeller
Flood Modeller time series results can be imported into TUFLOW Viewer using the "Load Results - Time Series FM" option. For more information on the files required, please see Load Results - Time Series FM.
Key to the time series results are the GIS layers created when the user imports FM results. There will be two vector files:
- _FM_PLOT_P - point layer
- _FM_PLOT_L - line layer
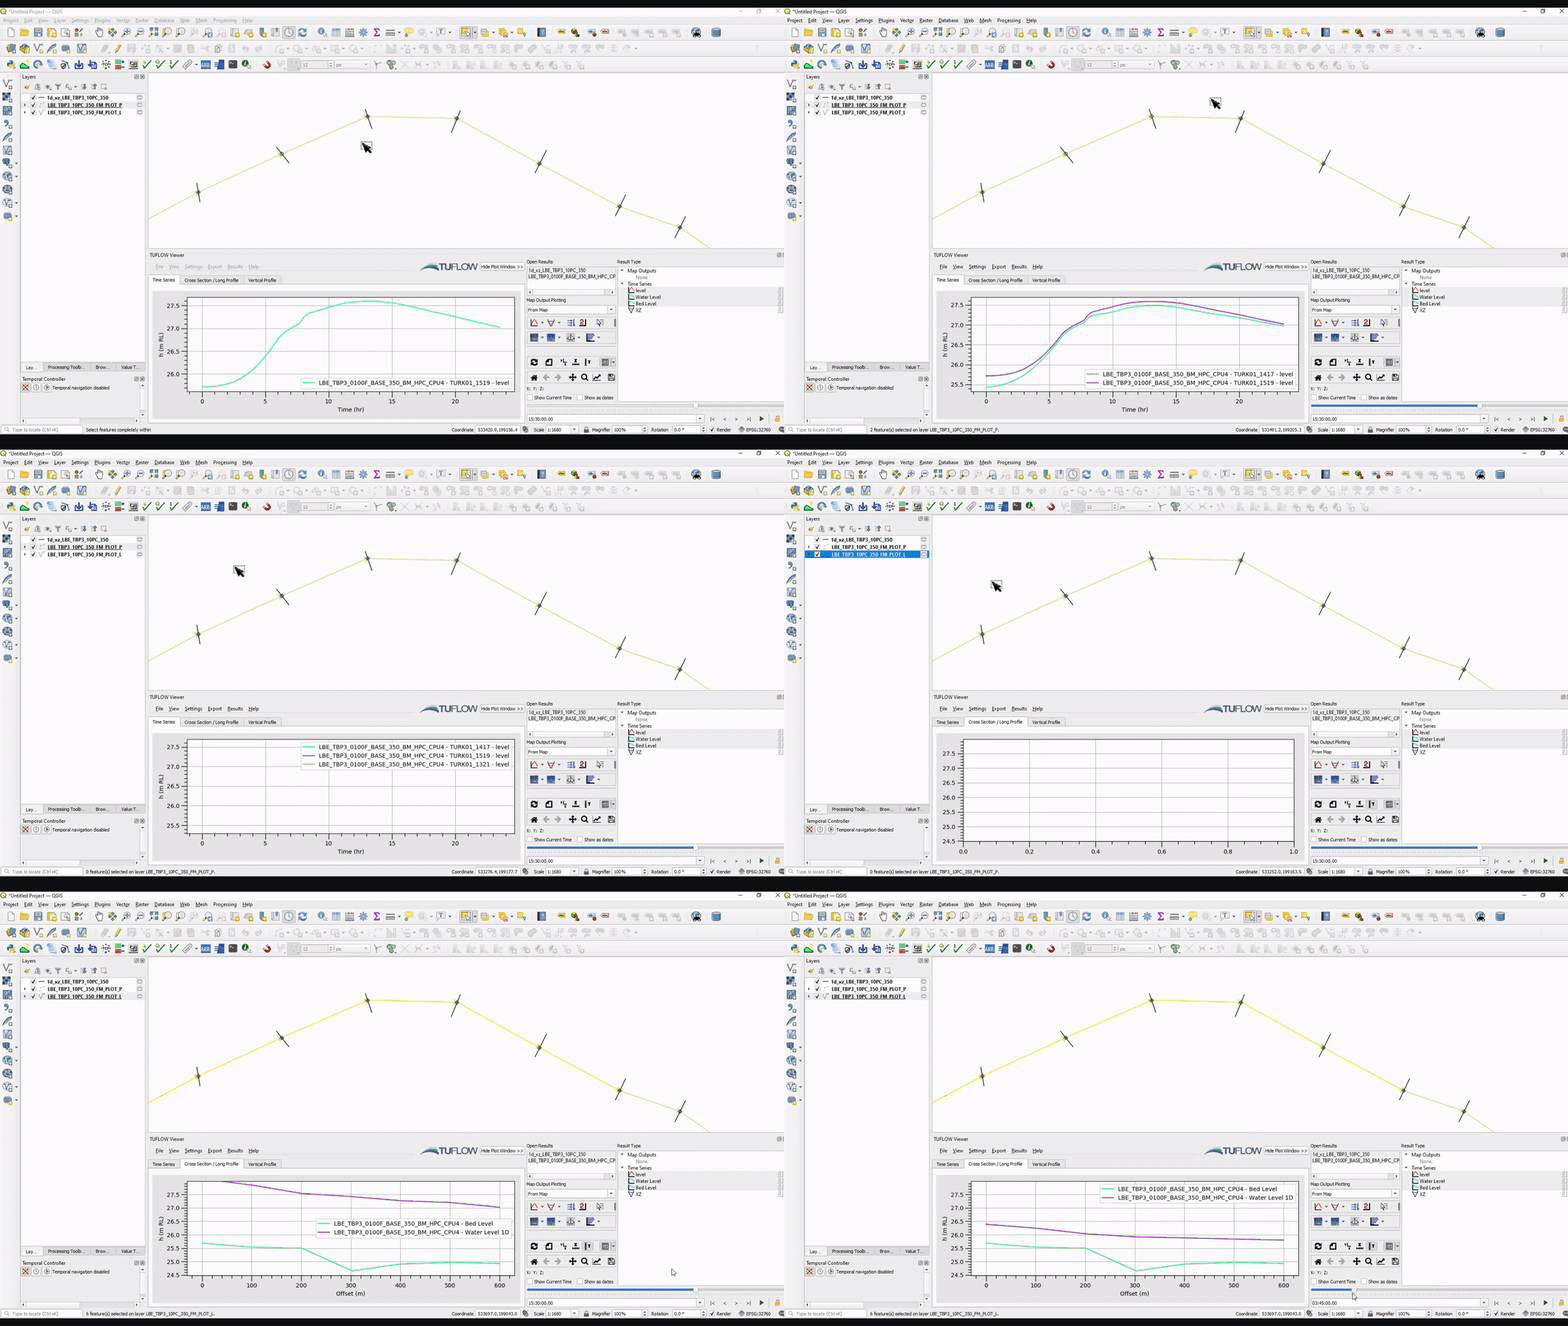
These layers are similar to the GIS files that are opened when loading ESTRY time series results. Unlike ESTRY, these files do not exist on disk and instead are created in memory (RAM). Therefore, these files will be deleted if QGIS is closed. To prevent this, users can save files in QGIS if desired (right click the layer in the Layers Panel and select "export" >> "Save Features As"). The time series results will be shown by selecting features in the point layer (_FM_PLOT_P). Currently TUFLOW Viewer only supports water level, velocity, and flow output types. The line layer (_FM_PLOT_L) is used for longitudinal plots. For more information on plotting results, please see the relevant link in the section below.
During the load process the user can choose to include the cross-section *.dat file which will also generate a cross-section GIS layer (again this is stored in memory (RAM), not on disk). This will enable the cross-sections to be viewed in TUFLOW Viewer and the bed elevation to be plotted for longitudinal profiles.
Example
| Up |
|---|


