Difference between revisions of "TUFLOW Viewer - Using A Date Axis"
Ellis Symons (talk | contribs) |
Ellis Symons (talk | contribs) |
||
| Line 35: | Line 35: | ||
===Links=== | ===Links=== | ||
====Similar Tools==== | ====Similar Tools==== | ||
| − | * [[TUFLOW_Viewer_- | + | * [[TUFLOW_Viewer_-_Using_A_Secondary_Axis | Using a Secondary Axis]] |
| − | * [[TUFLOW_Viewer_- | + | * [[TUFLOW_Viewer_-_Customising_The_Plot_Legend | Customising The Legend]] |
| − | * [[ | + | * [[TUFLOW_Viewer_-_Customising_The_Plotting_Styles | Customising The Plotting Styles]] |
| + | * [[TUFLOW_Viewer_-_Customising_The_Plot_Axes | Customising The Plot Axes]] | ||
| + | * [[TUFLOW_Viewer_-_Toggling_Plot_Grid_Lines | Toggling Plot Grid Lines]] | ||
| + | * [[TUFLOW_Viewer_-_Importing_a_Custom_Colour_Ramp_For_The_Curtain_Plot | Importing a Custom Colour Ramp For The Curtain Plot]] | ||
====Back to TUFLOW Viewer Page==== | ====Back to TUFLOW Viewer Page==== | ||
* [[TUFLOW_Viewer#Plotting | Back to TUFLOW Viewer Main Page]] | * [[TUFLOW_Viewer#Plotting | Back to TUFLOW Viewer Main Page]] | ||
Revision as of 00:30, 21 April 2021
Tool Description
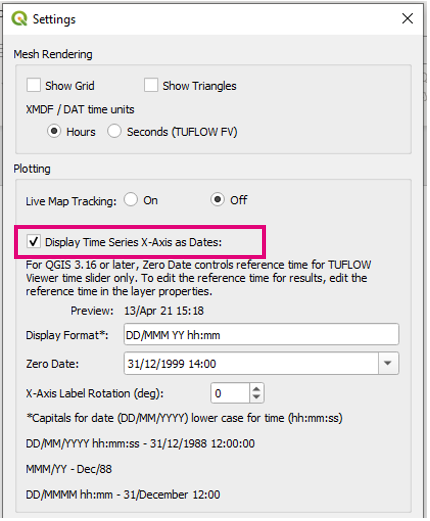
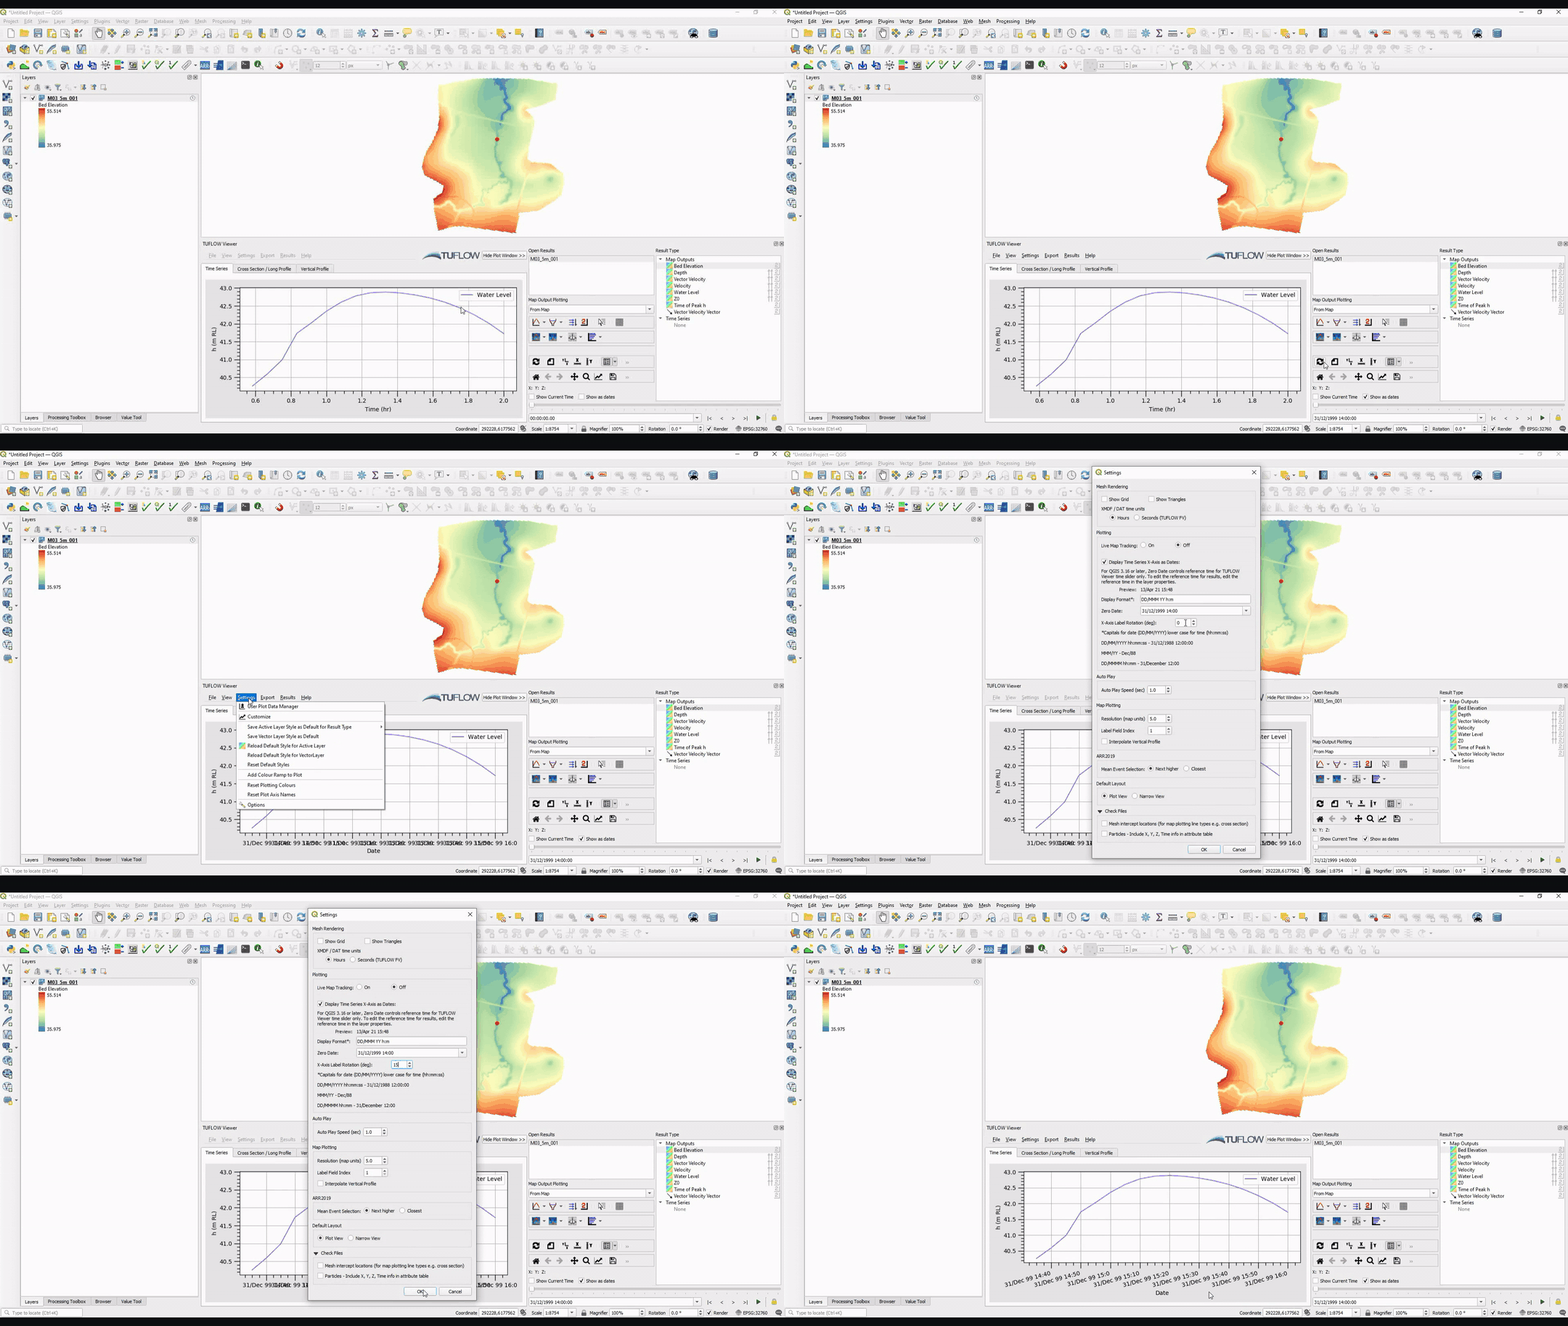
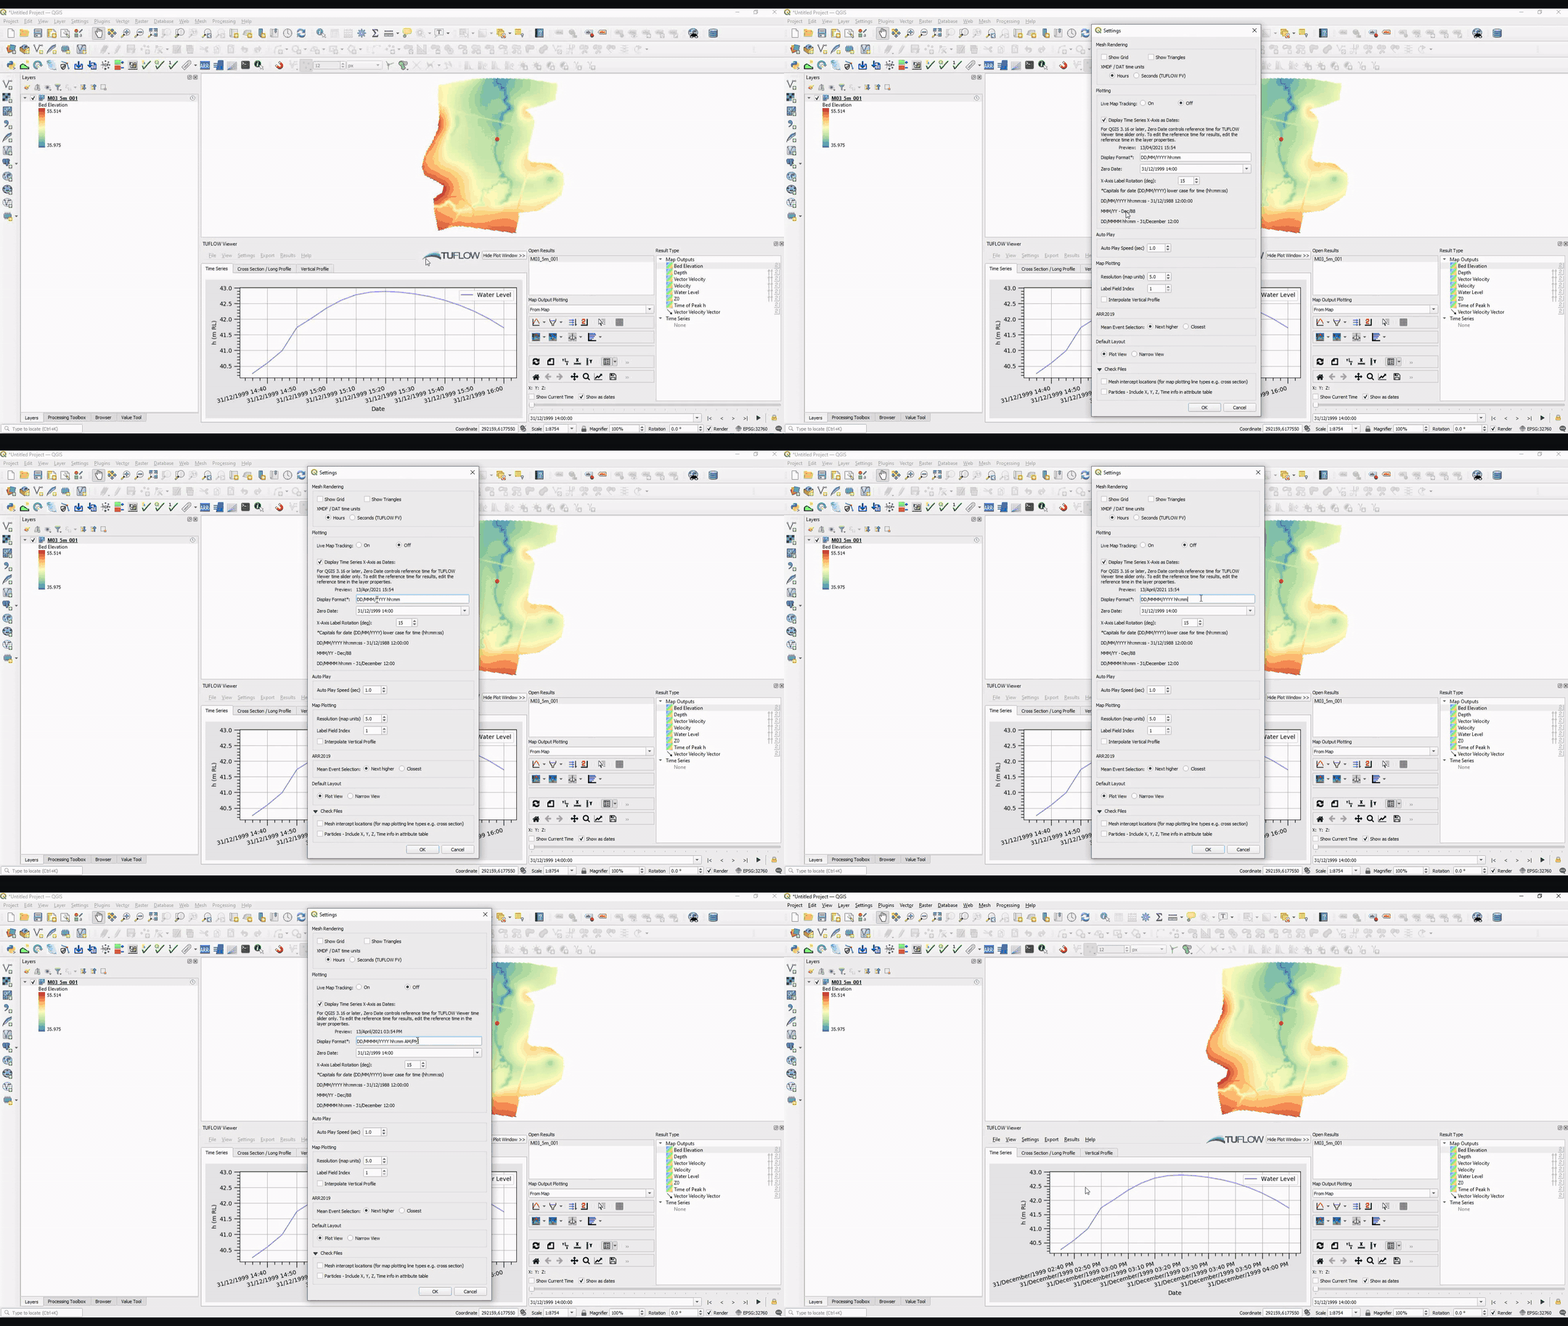
It is possible to change the x-axis of the time series plot from time (hrs) to date. This can be done either by checking on the Show as dates checkbox which is located above the time slider and then refreshing the plot ![]() , or via Settings >> Options then checking on Display Time Series X-Axis as Dates.
, or via Settings >> Options then checking on Display Time Series X-Axis as Dates.
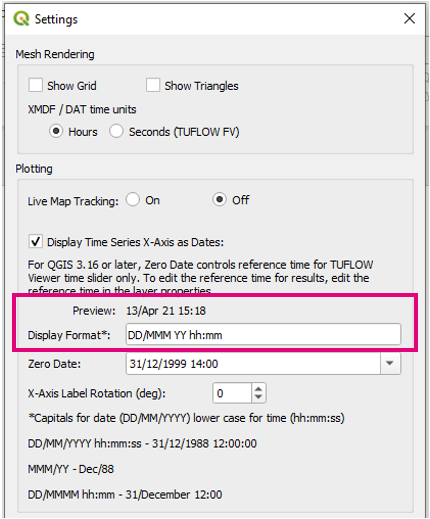
It's possible to change the date format displayed on the plot as well as change the label rotation to make the axis more legible by removing overlapping text. This can be done via Settings >> Options and changing the Display Format and X-Axis Label Rotation. The display format can be changed similar to how formatting is done in Excel and Python. The convention is as follows:
- Date formatters use upper case letters
e.g.- D/M/YY - 1/1/21 or 25/12/21
- DD/MM/YYYY - 01/01/2021 or 25/12/2021
- DD/MMM - 01/Jan or 25/Dec
- DD/MMMM - 01/January or 25/December
- Time formatters use lower case letters
e.g.- h:mm AM/PM - 3:00 PM
- hh:mm AM/PM - 03:00 PM
- hh:mm - 15:00
- hh:mm:ss - 15:00:00
Date and time strings can be used together in the date format and for convenience there is a preview of the date/time formatters to show the user how the formatting will appear.
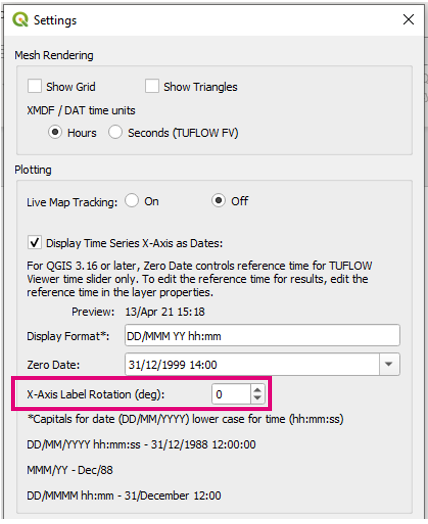
The X-Axis Label Rotation input can be used to rotate the date labels to prevent text overlap. The convention is in degrees from horizontal (0 deg is standard, no rotation). Negative rotation is allowed.
Note:
- The Zero Date option is not used to change displayed dates in QGIS 3.16+ for map outputs. To change the zero date / reference time in QGIS 3.16+ please see relevant link below
- The X-Axis Label Rotation will only work when the x-axis dates are being displayed as dates.
Examples
Example 1: Using Dates
Example 2: Changing Display Format
Links
Similar Tools
- Using a Secondary Axis
- Customising The Legend
- Customising The Plotting Styles
- Customising The Plot Axes
- Toggling Plot Grid Lines
- Importing a Custom Colour Ramp For The Curtain Plot
