Difference between revisions of "TUFLOW Viewer - Using A Secondary Axis"
Jump to navigation
Jump to search
Chris Huxley (talk | contribs) |
|||
| Line 13: | Line 13: | ||
[[file: Plotting_Secondary_Axis_Flux.PNG]]<br> | [[file: Plotting_Secondary_Axis_Flux.PNG]]<br> | ||
| − | === | + | ===Example=== |
[[File: Plotting_Secondary_Axis_Example.gif]] | [[File: Plotting_Secondary_Axis_Example.gif]] | ||
| − | + | <br><br> | |
| − | |||
| − | |||
| − | |||
| − | |||
| − | |||
| − | |||
| − | |||
| − | |||
| − | |||
{{Tips Navigation | {{Tips Navigation | ||
| − | |uplink=[[TUFLOW_Viewer# | + | |uplink=[[TUFLOW_Viewer#General_Plot_Display_Options| Back to TUFLOW Viewer Main Page]] |
}} | }} | ||
Revision as of 14:13, 2 June 2021
Tool Description
It is possible to use a secondary axis when plotting various results together. The secondary axis can be used for any plotting type (e.g. Map Outputs, Time Series, Hydraulic Properties, Time Series, Cross-Sections etc.). The one exception is curtain plotting, this will only ever be drawn on the primary axis. The vertical profile will use a secondary X axis, all other plotting types will use a secondary Y axis.
To use a secondary axis:
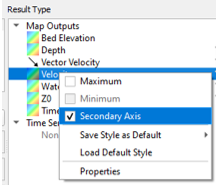
- In the Result Type widget, click the secondary axis icon
 next to the result(s) type that should be placed on a secondary axis. An alternative approach is to right-click the result type and checking on Secondary Axis.
- Initiate the plot by the standard process, or by refreshing the plot
 (the plot should automatically refresh when the secondary axis is activated).
- All instances of that result type should now be displayed on a secondary axis.

To plot flux on the secondary axis, use the button next to the plot flux button:

Example

| Up |
|---|