Tutorial M08 001 Results QGIS
Introduction
QGIS is used to load and view the 10m, 5m and 2.5m scenarios with the TUFLOW Viewer. For viewing of the 2D map results, see Module 1.
Method
Inspect the results from each scenario:
- Open the TUFLOW Viewer.
- Load the results using the TLF, this option loads both types of results, Map Outputs and Time Series. From File > Load Results, navigate to the Module_08\TUFLOW\runs\log folder and select the M08_10m_001.tlf, M08_5m_001.tlf and M08_2.5m_001.tlf files.
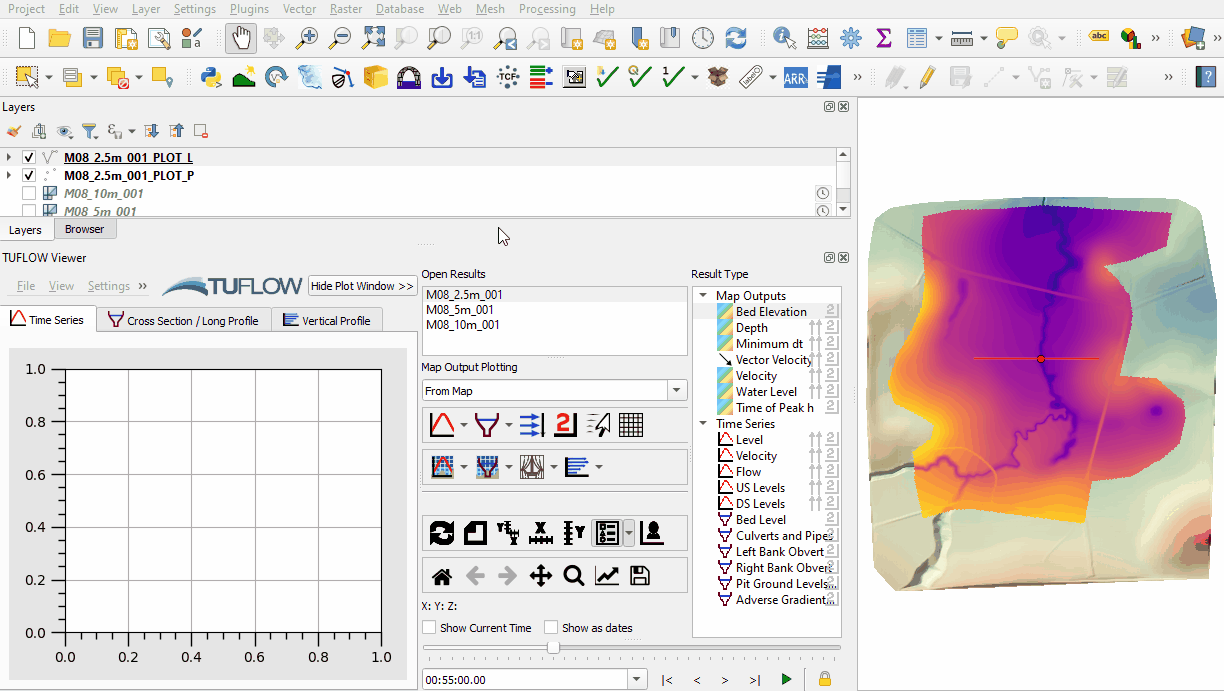
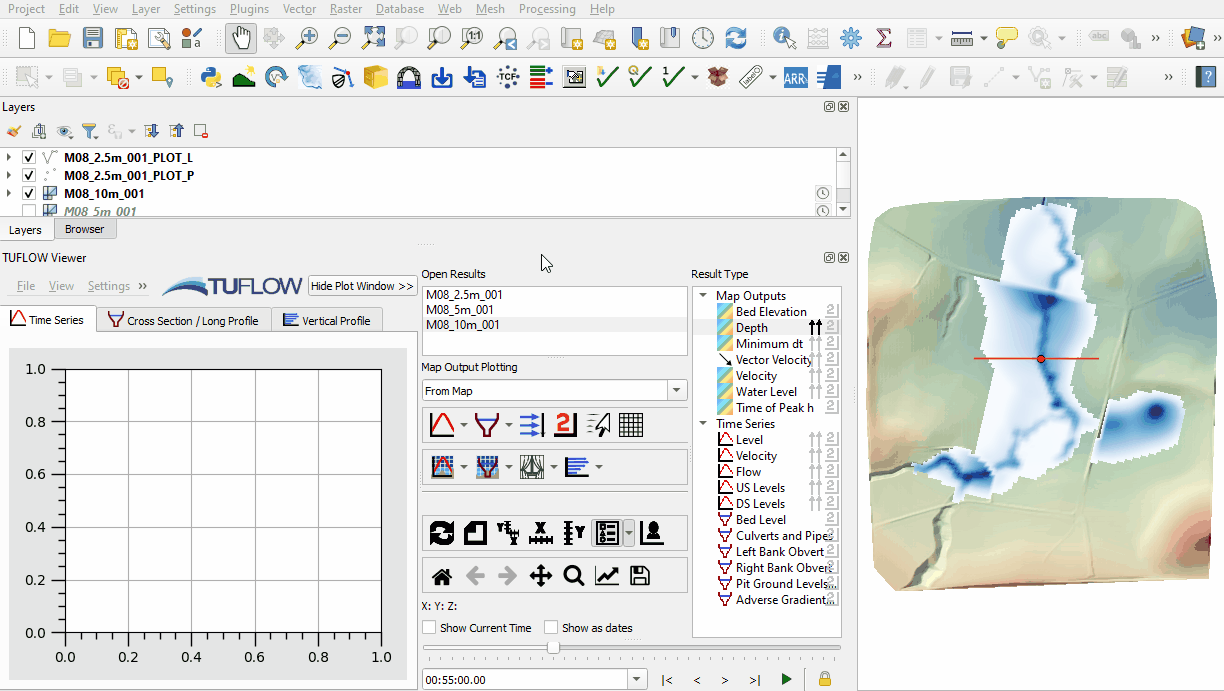
- Inspect the resolution of the results at the edges of the floodplain, the resolution is finer for the 2.5m simulation:
- Inspect the timeseries of the water level at the plot output:


Conclusion
- The results of the 10m, 5m and 2.5m scenarios were inspected using the TUFLOW Viewer.
- For further functionality, see TUFLOW Viewer.
| Up |
|---|