Tutorial M10 005 Results QGIS
Introduction
QGIS is used to view the water using Non-Newtonian fluids. The results are compared to Newtonian fluids from Part 4. For viewing of the 2D map results, see Module 1.
Method
Inspect water levels of the non-Newtownian outputs:
- Open the TUFLOW Viewer.
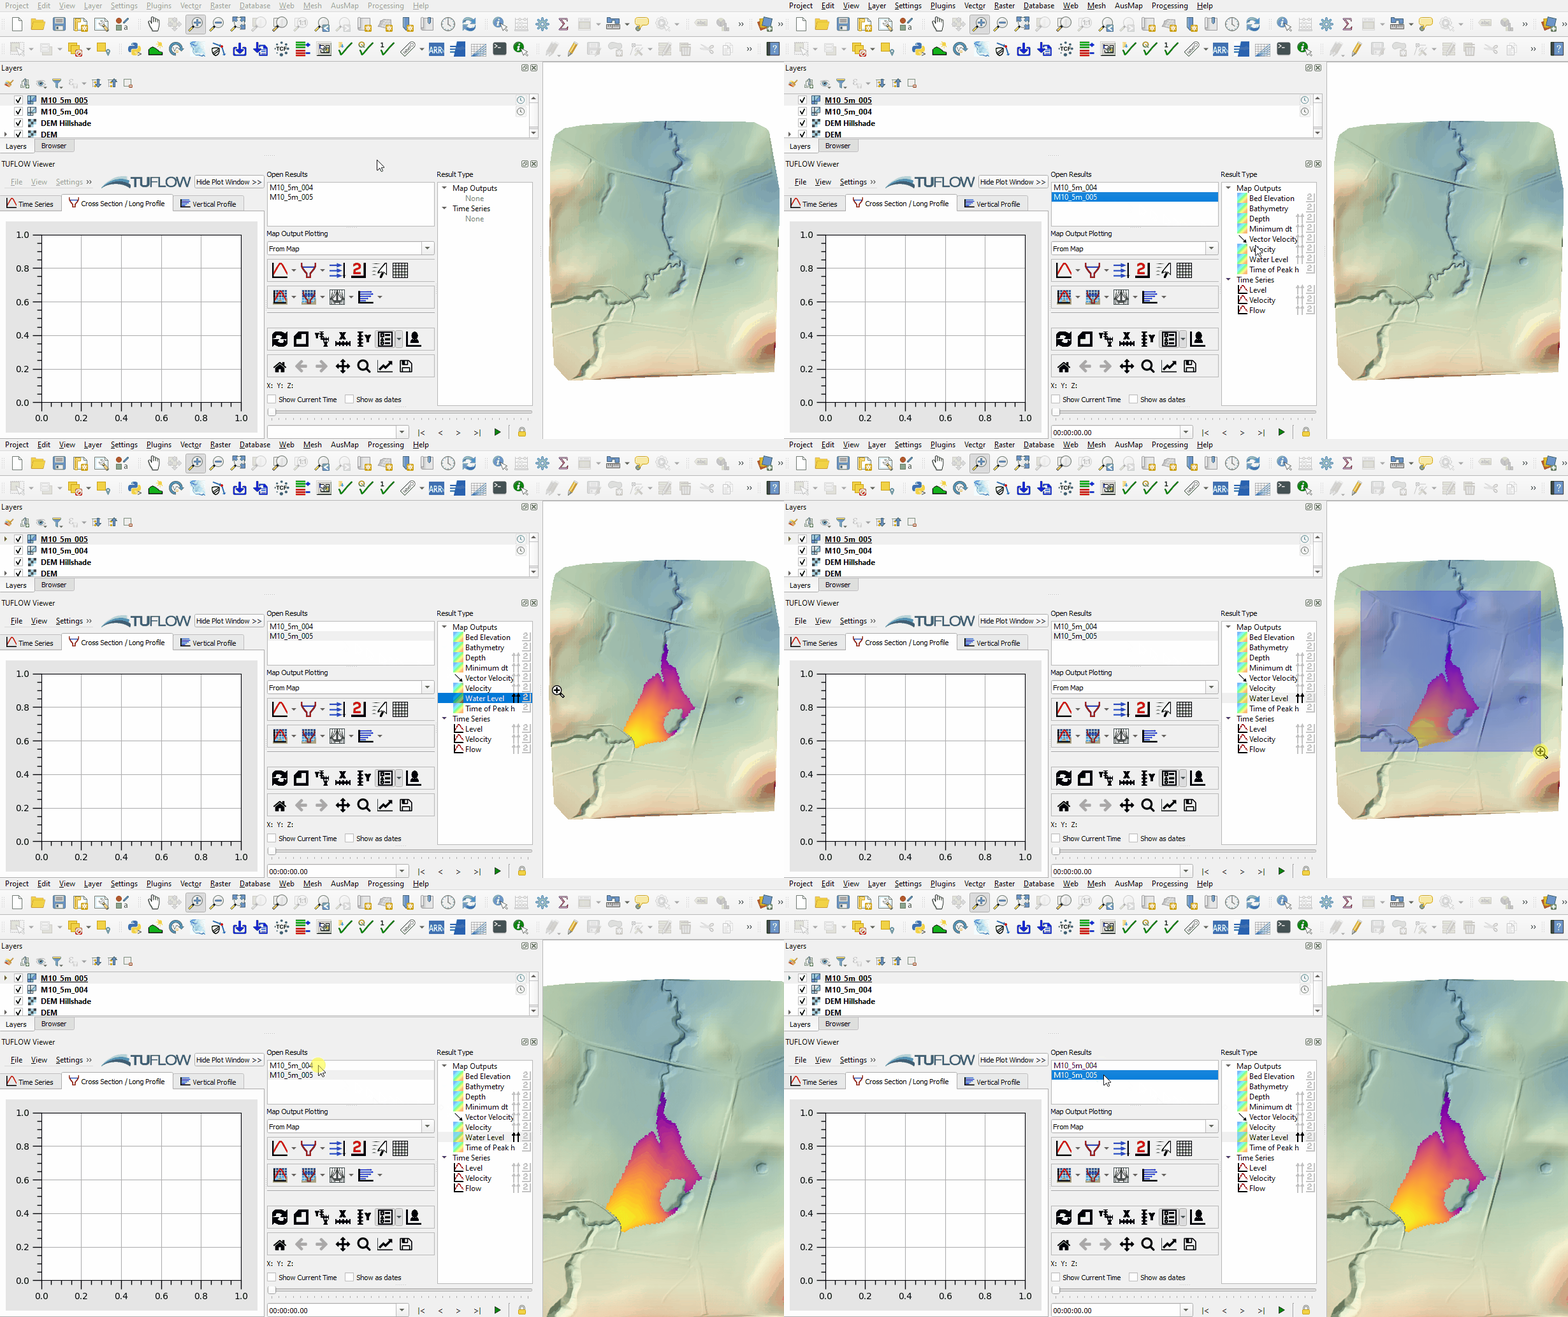
- Select File > Load Results. Navigate to the Module_10\TUFLOW\runs and open both M10_5m_004.tcf and M10_5m_005.tcf.
- Select the 'Water Level' map output type in the Result Type panel and toggle on 'Maximum'. Inspect the difference in water levels between M10_5m_004 and M10_5m_005:

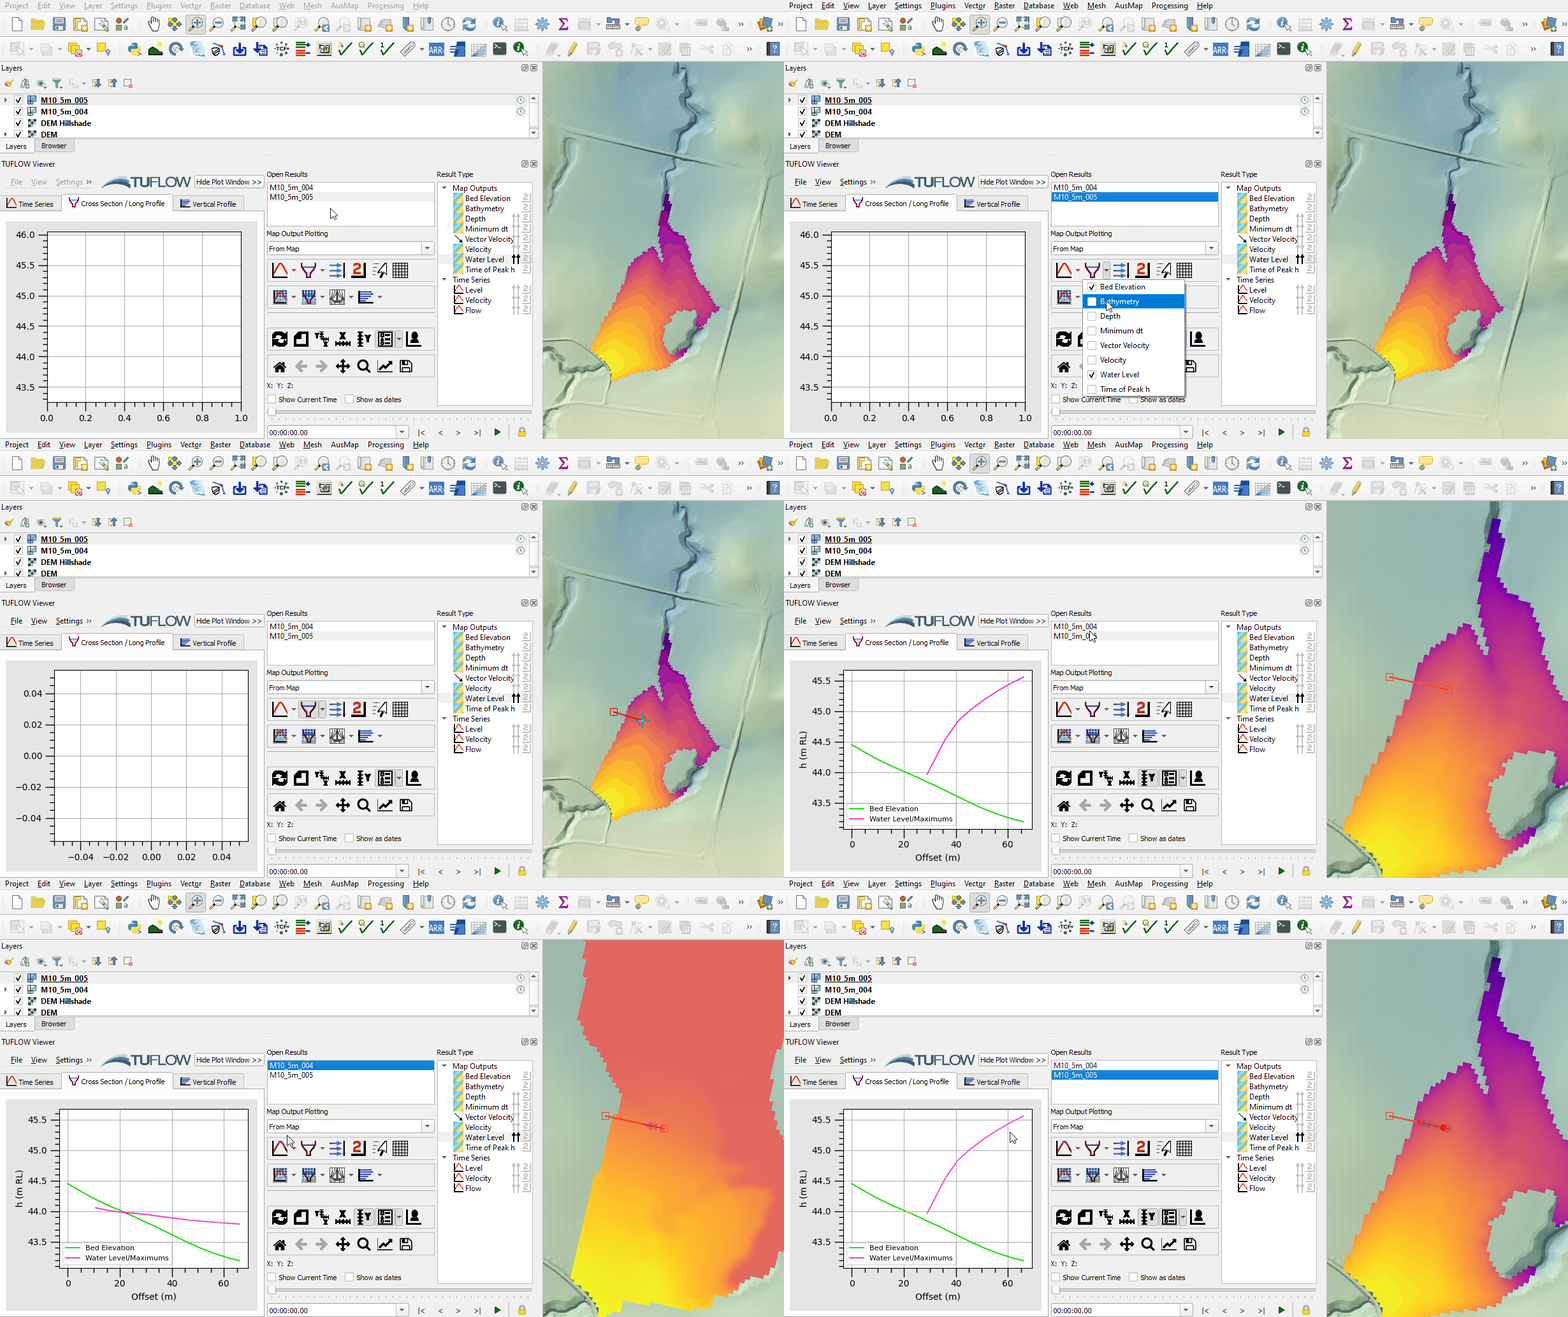
- Use the Plot Cross Section tool to see the cross section of the water level and bed level at the the edge of the flood extent.
- Compare the M10_5m_004 and M10_5m_005 results. The curvature of water level in M10_5m_005 demonstrates the Non-Newtonian fluid qualities. The viscosity of the fluid has changed, becoming more solid, due to the shear force as the fluid moves down the catchment:

Conclusion
- The water level outputs of the Non-Newtonian fluid were inspected and compared to a Newtonian fluid from Part 4.
- For further functionality, see TUFLOW Viewer.
| Up |
|---|