Tute M03 MI 2d zsh Archive
- In MapInfo, select File >>> Open.
- Navigate to the Module_Data\Module_03\ folder.
- In the Files of Type: drop down box, select Delimited ASCII (*.txt).
- As the files have the extension .xyz not .txt, type "*.*" into the Filename section and hit enter. Alternatively, the .xyz can be renamed as .txt.
- The .xyz files should be visible, select the Creek_Centre_Line.xyz and select Open.
- In the next dialogue the delimiter character can be specified, in this case it is ",". Select the "Use First Line for Column Titles" options (as per the image below. Select OK.
- Save a copy of the Creek_Centre_Line_XYZ into the TUFLOW\model\mi\ as 2d_zsh_M03_thalweg_001.TAB.
- Close the Creek_Centre_Line_XYZ file down and open the 2d_zsh_M03_thalweg_001.TAB. The MapInfo table does not contain any map objects, only the data stored in a tabular format. If you try to add the file to a map window, you will be unable to. We need to create points out of the data stored in the table. To do this:
- Select Table >> Create Points from the Menu options.
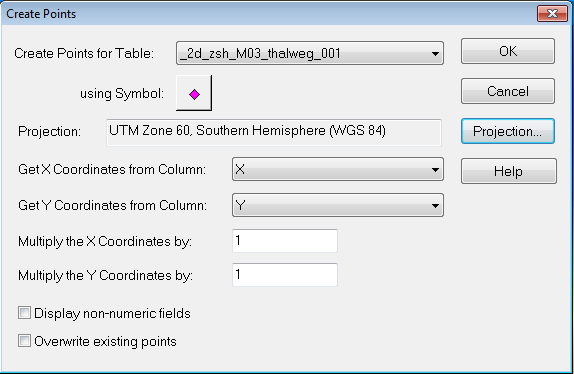
- In the Create Points dialogue:
- In the "Create Points for Table" drop menu, select the 2d_zsh_M03_thalweg_001;
- In the projection select the UTM Zone 60, Southern Hemisphere
- Tip: This is under the "Universal Transverse Mercator (WGS 84) and is the last entry in this category.
- Set the X and Y fields as the columns to get the X and Y data from.
The MapInfo file should now contain points, add the layer to a Map Window containing the DEM. You should see the points as per the image below, if the points are not visible, check that they have been created in the correct projection.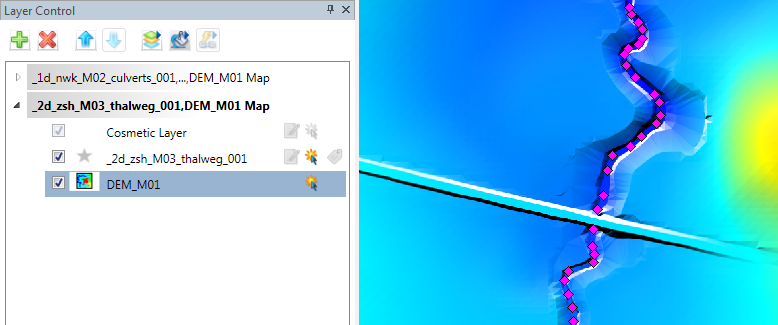
The 2d Z Shape (2d_zsh) format requires the input data to be in the format outlined in Table 4.8 of the 2010 TUFLOW manual. The first four columns of the table should contain the following attributes:
- Z
- dZ
- Shape_Width_or_dMax
- Shape_Options
The first three are numerical fields ("float" type in MapInfo) and the fourth a character field of length 20. The table can have additional columns, these will be ignored by TUFLOW.
- To manipulate the table attributes, select Table >> Maintenance >> Table Structure...
- The table already has a "Z" attribute, but we need to add three additional fields, "dZ" (float), "Shape_Width_or_dMax (float) and Shape_Options (character - length 20). Using the "Up" and "Down" buttons, manipulate the data so that the "X" and "Y" columns are the final two columns, as per the image below. As the X and Y columns aren't used by TUFLOW (the coordinates are stored in the point objects), the X and Y columns could be deleted from the table entirely.
- After the table structure has been modified, the layer will be removed from any Map Windows. Add the layer the a Map Window containing the DEM. The data contains only points, no lines have been provided, we will need to digitise these.
- Make the layer editable and ensure that the "Snap" utility is enabled ("S" Shortcut key).
- Starting at the upstream end, create a polyline joining the points together. The line should snap to all of the points. Make sure to terminate the line and restart it upstream and downstream of the road embankments.
- Tip: If you make a mistake the backspace key can be used to remove the last vertex digitised.
- For each of the lines, set the following attribute:
- Z = 99 (this won't be used as the elevation data is provided in the points)
- dZ = 0
- Shape_Width_or_dMax = 0
- Shape_Options = Min
The breakline to represent the creek centre line is now ready for input into TUFLOW.
- Repeat the process described above:
- Import the Road_Crest_Survey.xyz and create a new file called 2d_zsh_M03_Rd_Crest_001 in the TUFLOW\model\mi\ directory;
- In the 2d_zsh_M03_Rd_Crest_001 create points from the tabular data;
- Modify the table structure to match the 2d_zsh format; and
- Digitise three lines, one for each road, as per the image below.
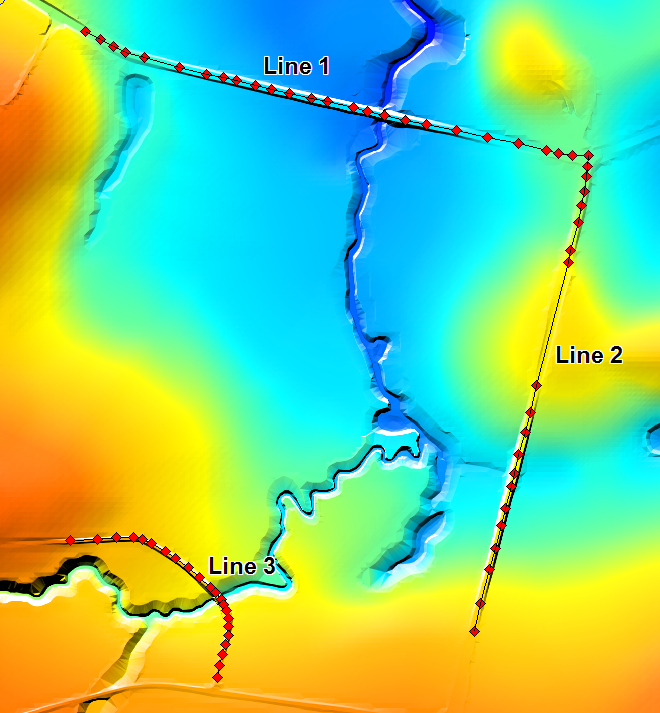
- On the lines shown above, enter the following attributes:
GIS Attribute Line 1 Line 2 Line 3 Z 99 99 99 dZ 0 0 0 Shape_Width_or_dMax 5 0 0 Shape_Options MAX MAX MAX As per the creek line above, the elevations are associated with the points and a dummy value of 99 is used on the line (the actual value is unimportant). If no points are in the layer, the elevation on the line object is used, i.e. the elevation along the line does not vary.
As explained in Table 4.8 of the 2010 TUFLOW manual, for a line object the Shape_Width_or_dMax, controls the width of the breakline in metres. Depending on the cell size the following methods of application are used:
- Shape_Width_or_dMax = 0 - a "thin" breakline is used, only elevations on the cell side are modified (no change in storage);
- Shape_Width_or_dMax less than or equal to 1.5 times the cell size - a line of whole cells are modified (a "thick" breakline); or
- Shape_Width_or_dMax greater the 1.5 times the cell size - a "wide" breakline, elevations in multiple cells are modified. Any Zpts within a distance of half the Shape_Width_or_dMax are modified.
For the tutorial model a cell size of 5m is used, therefore, line 1 will be a "thick" formulation and line 2 and line 3 will be using a "thin" breakline. Later in the module we will looking at the check files to review which Zpts are modified.
Introduction
In this page, we import data from text file format into a MapInfo file. Once the data is in MapInfo format we will manipulate into a TUFLOW 2d Z Shape (2d_zsh) format ready for input into TUFLOW.
Method
Two separate sets of data have been provided in the \Module_Data\Module_03\. These are simple text files with the .xyz extension, as the name suggest these contain coordinates in a x, y and z format. In this case they are comma separated. A similar process could be used for space or tab delimited data.
Importing Text Data
The first step is to import that data into MapInfo, to do this:


The data should now be displayed in a browser format like the image below. The next step is to manipulate the data into a format suitable for import to TUFLOW.

2d Z Shape Format


Conclusion
Two datasets have been imported into MapInfo and manipulated into a TUFLOW Z Shape format (2d_zsh). The next step is to modify the control files, please return to the module 3 page.