M02 QGIS 1D Results Archive
- From the TUFLOW\results\M02\1d\ folder open the following files:
- M02_5m_001_1d_mmH_P.shp
- M02_5m_001_1d_mmQ_P.shp
- M02_5m_001_1d_mmV_P.shp
- Navigate to one of the culvert locations.
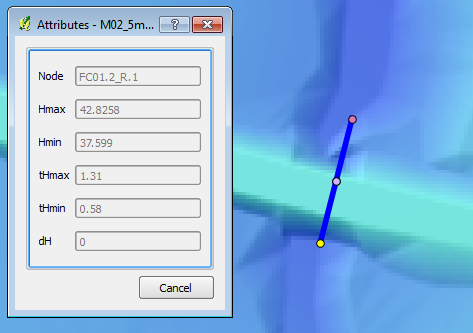
- At both ends of the culverts there is a point which contains the water level results, at the channel centre are points in the flow and velocity results. Use the info tool to interrogate the results, the following information is displayed for the water level results:
- Node ID (Node)
- Maximum Water Level (Hmax)
- Minimum Water Level (Hmin)
- Time of max water level (tHmax)
- Time of min water level (tHmin)
- Change in water level from upstream node (dH)
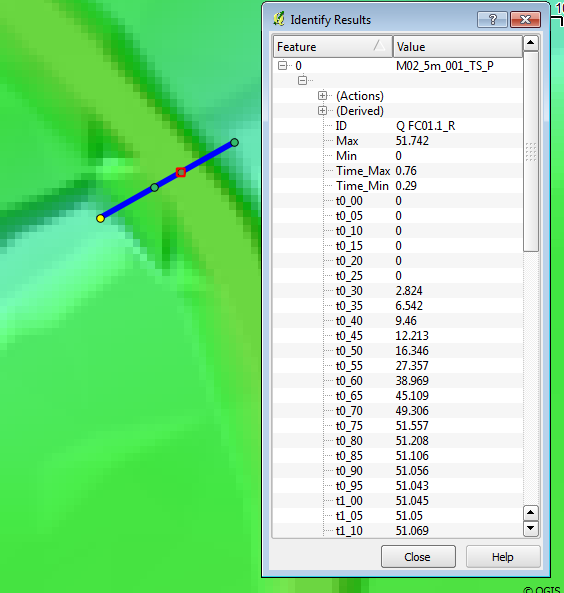
- Open the M02_5m_001_TS_P.shp file from the TUFLOW\results\M02\1d\ folder.
- Zoom to one of the culvert locations, there should be four objects in the M02_5m_001_TS_P layer, the nodes at the end of the culvert contains water level information, the two points along the culvert contain the flow (downstream point) and velocity (upstream point).
- Click the information tool on one of the results locations, in the information window the first column contains the ID, the next four columns contain the maximum and minimum results, after this the value at each output interval is displayed. For example t0_05 contains the output for time = 0.05 hours (3 minutes / 180 seconds).
-
These values are also outputted in .csv file format so the date can be viewed in Excel. We review this in the next section.
Introduction
In this page we will review the GIS outputs for the 1D model. We will look at the maximums (flow, level and velocity) as well as the time-series. These are described separately in the sections below.
Maximums

Time-series
Time-series outputs are written to the GIS format, QGIS does not have a inbuilt method for visualising these results. For MapInfo the miTools utilities allow these results to be plotted within the GIS package. There is not currently a version available for QGIS. The results values can be viewed in QGIS, however we will plot this in Excel in the next section of module 2.

Conclusion
QGIS has been used to review the GIS outputs for the 1D culvert results. Return to the module 2 page, where the next step is to view the results in Excel.