QGIS Creating a Grid from Points
Jump to navigation
Jump to search
Introduction
In this page a DEM is created from point shapefile containing elevations. For this example the zpt_check file from module 1 of the TUFLOW tutorial model will be used, but the process can apply to any point layer. This is useful for visualising the final elevations for a model simulation from a TUFLOW Zpt Check file.
Method
- Install the Interpolation Plugin via Plugins >>> Manage and Install Pllugins
- Open the desired shapefile in QGIS.
- Select Raster >>> Interpolation from the menu items.
- In the Input section of the Interpolation dialogue, use the drop down list to select the appropriate Vector Layer, select the attribute to interpolate. This is the Elevation attribute if using a check file. Select Add to include this in the interpolation.
- In the Output section of the dialogue:
- Set a interpolation method. For this demonstration a TIN method is used, but feel free to experiment.
- Set the X and Y cell size to an appropriate number (half the cell size if using a zpt_check file).
- Specify the output file name.
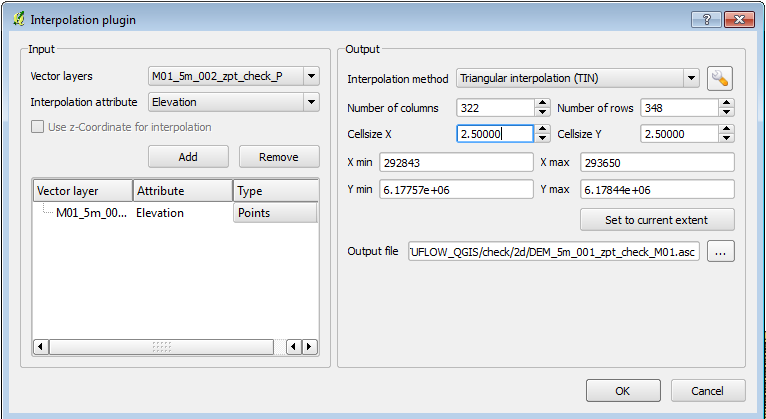
- Select OK and the interpolation will be processed, this may take a few minutes depending on the number of points.
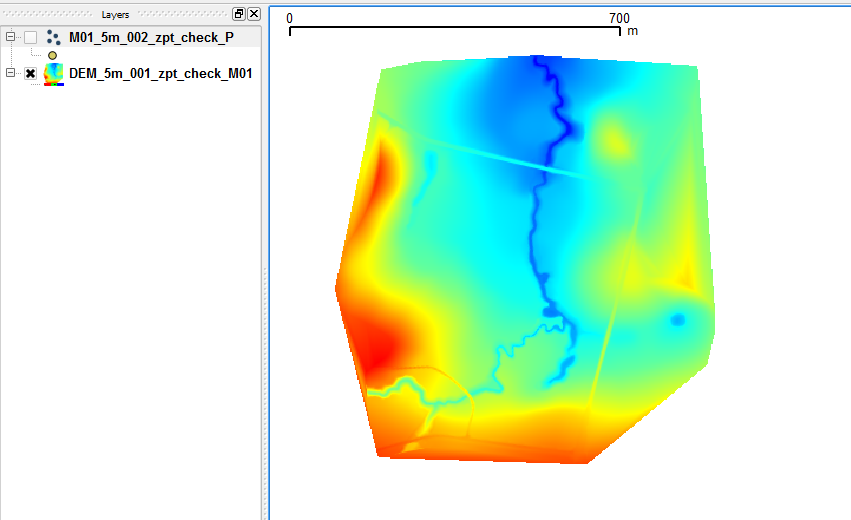
- In the properties dialogue, set the Style Colormap to "Pseudocolor" for a quick visualisation, or alternatively set a custom colormap. The grid should appear as below.
- Tip: To enable relief shading see the relief shading tip in the QGIS tips and tricks.


| Up |
|---|