TUFLOW Viewer - Batch Exporting Maps
Jump to navigation
Jump to search
TUFLOW Viewer offers the ability to batch export maps using mesh layers. This tool does not seek to replace other similar tools that may be inherently built in to QGIS, however does offer the ability to:
- Automatically add plots from the mesh layer to the maps.
- Automatically load mesh results, plot, and export maps.
It also offers convenience functionality for adding items (such as a legend, images and scales), however these can also be added manually in the print layout.
The following steps through the process of batch exporting maps:
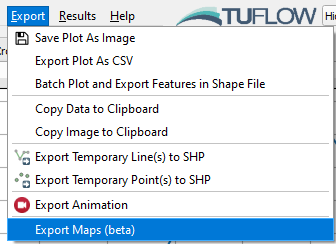
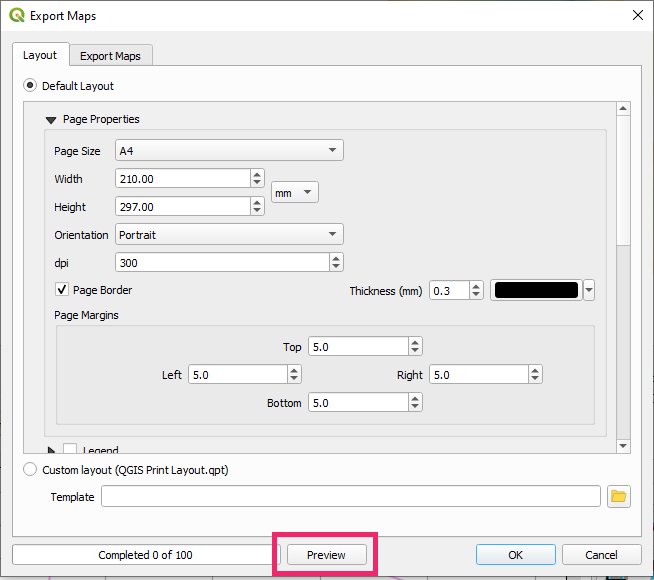
- Open the batch export map tool via Export >> Export Maps
- In the layout tab, the user has the option to use a Default Layout or a Custom Layout. A custom layout uses a Print Layout Template (.qpt) as an input. The recommended workflow is to:
- Use the Default Layout initially.
- Customise the layout using the print layout in QGIS.
- Export the print layout as a template (.qpt).
- Use Custom Layout using the created template file.
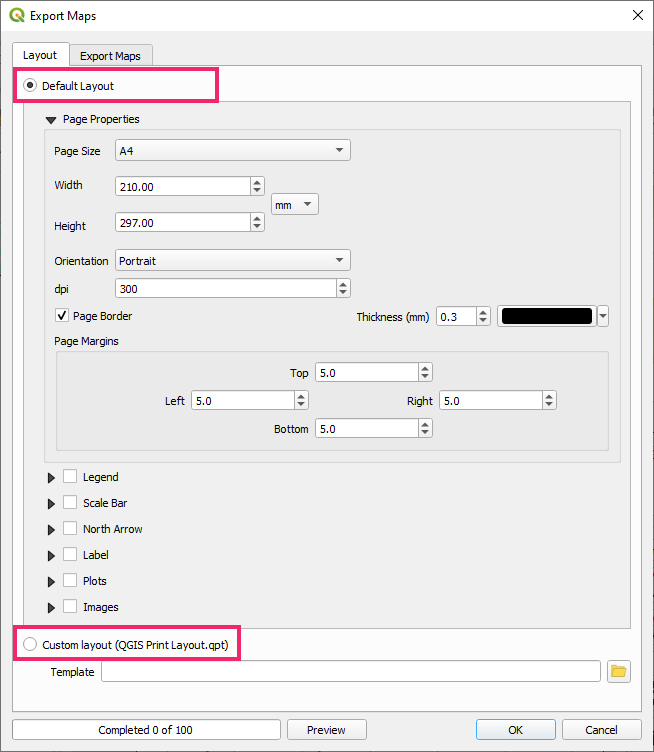
- During Step 1 above, the Default Layout lets the user specify some items to add to the layout.
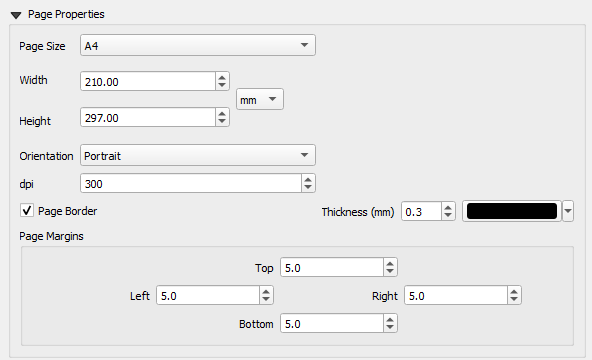
- Page Properties - defines the page size and the orientation of the exported maps. A page border is added by default, however can be turned off or edited in this section.
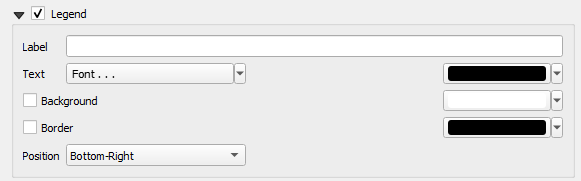
- Legend, Scale Bar, North Arrow - the next three items will add common map items. Users can edit the properties of the item and add things like a background and border.
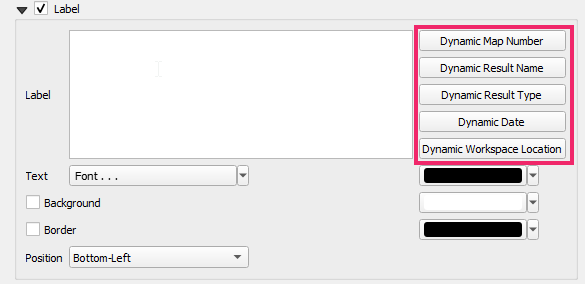
- Label - Users can also add a custom label with dynamic text. This is useful if the user would like to add information to the map such as the result name, result type, or date the map was produced. This can be done by using the buttons on the right-hand side of the label properties. User's can also add their own text to the label, however this will be static.
- Dynamic Map Number - will add a map number to the label based on the order that the maps are exported.
- Dynamic Result Name - will add the result name to the label (e.g. M03_5m_001).
- Dynamic Result Type - will add the result type to the label (e.g. Depth - Max).
- Dynamic Date - will add the date the map was exported.
- Dynamic Workspace Location - will add the workspace path to the label.
- Plots - These are dynamic plot objects that will be added to the maps. To add a plot, the plot must already be available in one of the TUFLOW Viewer plotting windows.
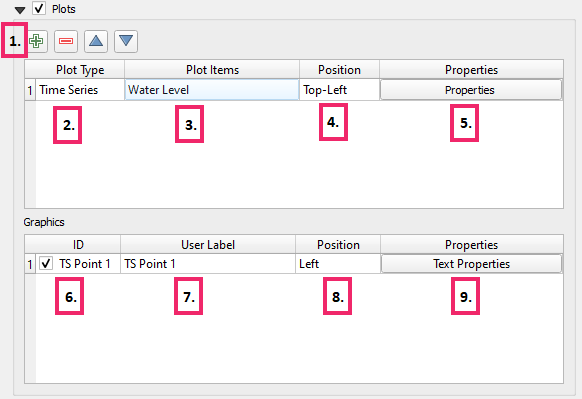
- Use the add button
 to add a plot.
- Select the source of the plot lines that will be added (i.e. time series, cross section etc.).
- Select the plotting lines to add to the plot. Users can add more than one line or split the lines onto multiple plots. If the line is on secondary axis, this will be retained unless the need for the secondary axis becomes redundant (e.g. it's the only line on the plot).
- In addition to the plotted result types, users have the option of specifying Active Dataset and Active Dataset [Water Level For Depth]. This will use the plot location, but plot the active scalar result of the map. The latter option will use water level if the active scalar is depth. This option will not work for plotting from a vector layer if the user is using one of the fields for the plot legend entry (this will need to be turned off in the Settings >> Options >> Plotting.
- Set the position. This is only the starting position and can be moved later in the print layout.
- Set the plot properties. When the user clicks this button, TUFLOW Viewer will calculate the min/max for the plot axes. For lines on the cross-section and vertical profile plots, this can take some time as TUFLOW Viewer will need to step through every timestep to find the min/max values.
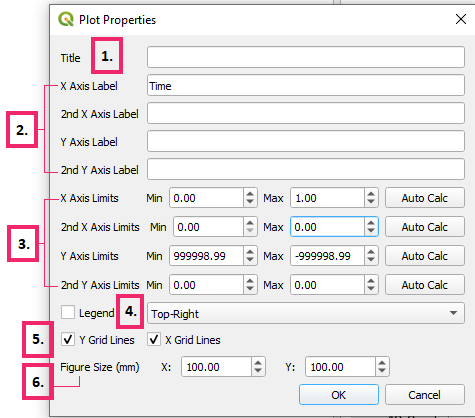
- Plot Title - can be useful to indicate where the plot was extracted from by aligning the title with labels in the print layout.
- Axis labels - will be populated with default values.
- Axis Limits - will be populated with calculated extents and the extents can be recalculated using Auto Calc.
- Legend - legend can be added or removed. Legend location options are not as extensive as the TUFLOW Viewer itself, most notably 'Auto' is not available.
- Grid lines - can be toggled on/off.
- Figure Size - will default to 100 x 100. This can be changed in the print layout and the plot will be re-rendered prior to the animation to fit the desired size.
- If the plot point/line was drawn by the user (not a vector layer), a graphic object will be added to the appropriate location to indicate the extraction location. This can be toggled off by unchecking this box.
- Label for the graphic object - this can be changed later in the print layout
- Label position relative to the graphic object
- Label properties:
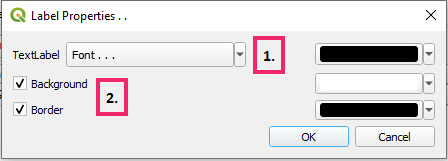
- Label font settings
- Background and box settings
- Use the add button
- Images - Adds static images (e.g. company logo) to the maps. Adding images can also be added / edited later in the print layout.
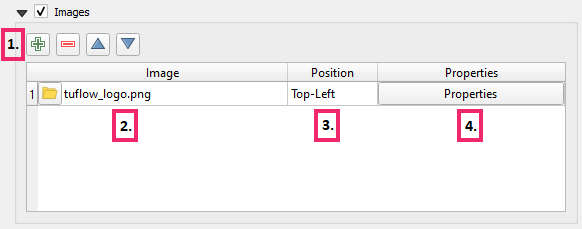
- Use the add button to add an image.
- Browse or copy the file path location of the image to be added.
- Position - this is the starting position and can be changed later in the print layout.
- Image properties:
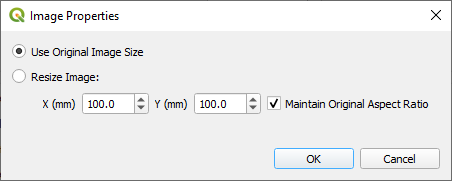
- Image size options - this can be changed later in the print layout.
- Use the add button
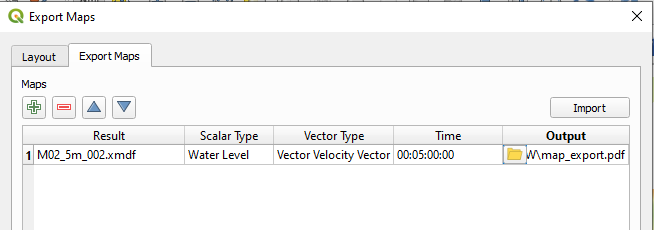
- Add maps in the Export Maps tab.
- Result - result file (e.g. the .xmdf file). Results can be chosen from mesh layers that are already loaded into QGIS, or a file path can be specified and the tool will automatically load the mesh when required.
- Scalar Type - scalar result type to be mapped. If the result isn't loaded yet, the user will need to type this result type in manually.
- Vector Type - vector result type to be mapped. If the result isn't loaded yet, the user will need to type this result type in manually.
- Time - timestep used for the map. If the result isn't loaded yet, the user will need to type this result type in manually.
- Output - output location of map.
- Users can import a list of maps from a csv file using the Import button. This allows users to use a program such as MS Excel to populate the map list.
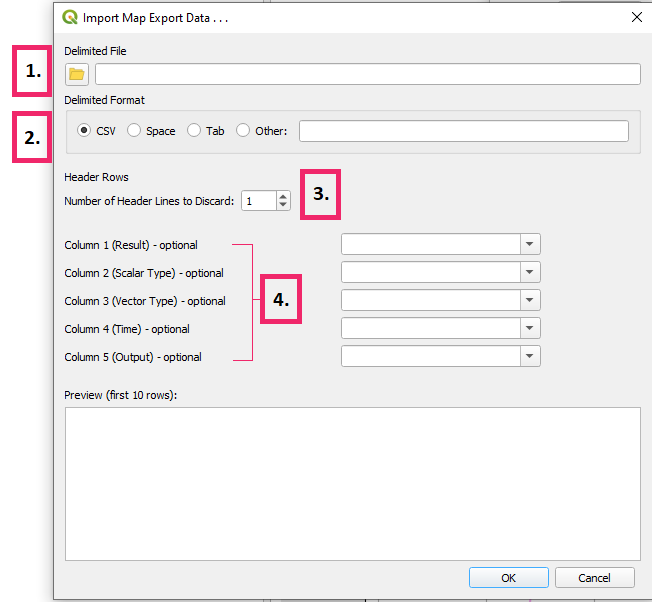
- Delimited File - csv (or other text file) containing the map list.
- Delimited Format - delimited format of the input file.
- Header Rows - number of header rows to discard.
- Columns - the columns that correspond to the appropriate columns in the tool. If the column names match the names in the tool, the import tool will automatically populate these values.
- Once all layout items have been chosen and added, clicking Preview will allow the user to view how it's going to look.
- Clicking the preview button will open up the layout in the QGIS print layout. In this layout, the user can modify, move, resize, add, and remove items in the layout. The following items must retain their IDs:
- The dynamic label must have the ID 'title'.
- Dynamic plots will have an ID 'plot_<n>' where <n> is the plot index (starting at index 0) based on the order they were added in the Default Layout.
- The graphic objects have an ID corresponding to their ID in the Default Layout.
- All plot items are listed in the 'Items' box and their corresponding ID. Items can be selected in this box to show their properties and allow users to edit them (they can also be selected in the print layout).
- Item properties can be edited using the Item Properties tab below the 'Items' box.
- Use the tool Interactively Edit Map Extent
 to edit the zoom and position of the map in the print layout.
 - When the map zoom and extents are adjusted the graphic objects will no longer be in the correct position, however that's ok because the next time either the preview is clicked or if the export maps tool is run, they will be placed in their correct position.
- Use the tool Select / Move Item
 to move and resize items in the print layout.
 - Use Add Item menu to add other custom items such as a north arrow or scale bar.
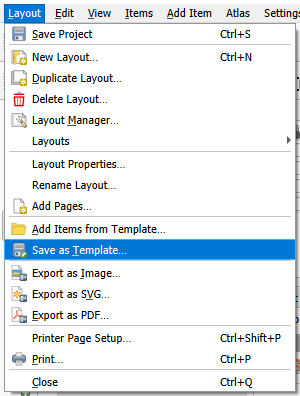
- Save the print layout as a template (.qpt) via the menu Layout >> Save as Template.
- Close the print layout.
- Select the Custom Layout radio button in the layout tab in the export animation dialog and browse the saved template file (.qpt).
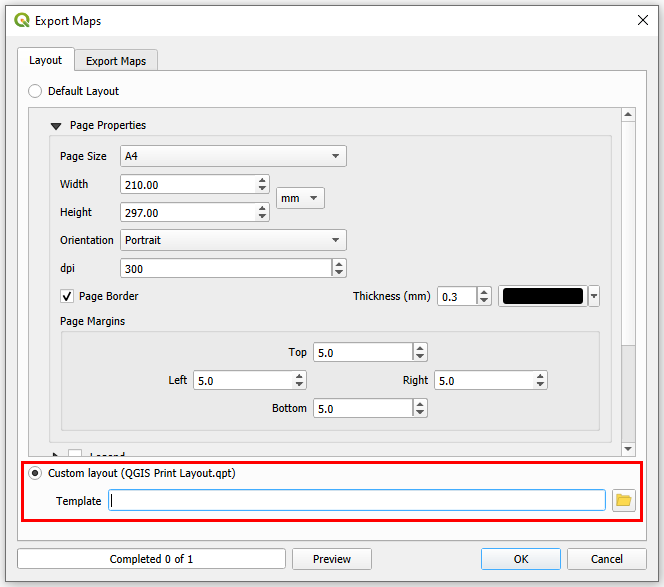
Note that all the default layout items will be overridden with the Custom Layout except for the plots and dynamic text. The plot position and size from the custom layout template will be used, however the plot content will still be taken from the Default Layout. Likewise for the dynamic text, the text will be taken from the Default Layout. - The Preview button can be used multiple times to check that the layout is correctly being imported from the template.
- Click Ok to run the tool and export the maps.


| Up |
|---|