TUFLOW Viewer - Map Outputs - Plotting Time Series
Plotting a Single Inspection Point
Tool Description
Extracts time series results from a point from the map outputs. Users can choose one or multiple results types to plot at once. For 3D map outputs, the tool will use the current 3D to 2D depth average rendering method.
To use the tool:
- Select which result type to plot using the down arrow next to the time series icon in the toolbar.
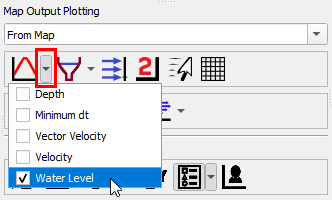
- Click off the drop down menu somewhere in a blank section of the TUFLOW Viewer toolbar.
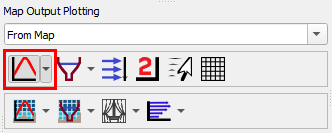
- Click the time series icon so that it becomes indented and the cursor changes to a crosshair.
- Select a location on the map outputs to plot from.


Example
Plotting Multiple Inspection Points
Tool Description
It is possible to plot from multiple locations when plotting from the map outputs.
To plot from multiple locations, change From Map to From Map Multi in the dropdown box above the map plotting icons. For single point plotting (e.g. time series) continuing to left click to add locations and right click to finish. For polyline plotting (e.g. cross-sections), select the chosen plotting icon again to start drawing a new line after finishing the previous polyline.

Note: It is also possible to plot from multiple locations using the option Layer Selection and selecting multiple features.
Example
| Up |
|---|