TUFLOW Viewer - Summary Of Options
Jump to navigation
Jump to search
Tool Description
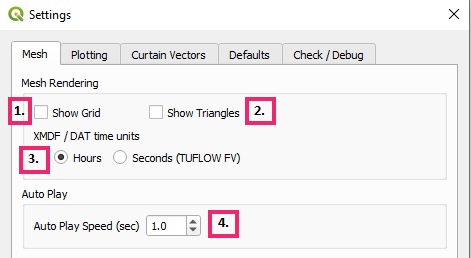
- Show Grid - Toggles mesh rendering.
- Show Triangles - Toggles triangle rendering - triangles are used for mesh resampling.
- XMDF / DAT time units - Tells TUFLOW Viewer the units of the mesh layer so the time slider can be set accordingly. TUFLOW Viewer will default to hours in most instances, however will make assumptions when seconds is an appropriate unit to use. Users can switch the setting at any time and TUFLOW Viewer will update the time slider.
- Auto Play Speed - The speed at which the time slider will auto progress when the play
 button is pressed.
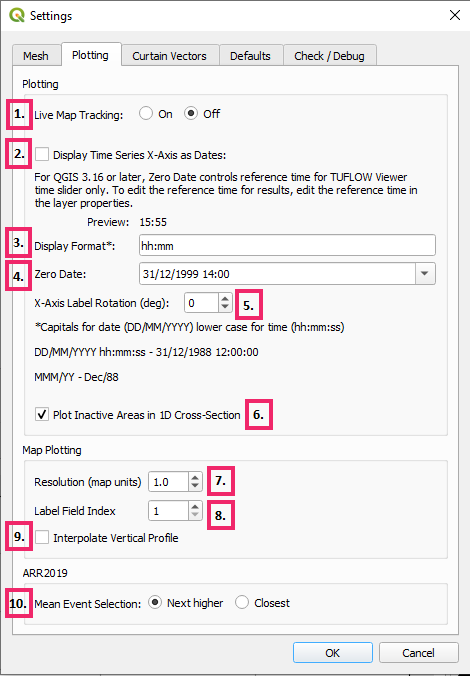
- Live Map Tracking - Toggles live cursor tracking - see Auto Update Plot From Cursor Location
- Display Time Series X-Axis as Dates - Toggles date-time format.
- Display Format - Changes the plot date-time format (doesn't change the date-time format displayed in the time box).
- Zero Date - Changes the zero date-time - see Working With Isodate (Date-Time) format
- X-Axis Label Rotation - changes the rotation of the x-axis tick labels when displaying as dates.
- Plot Inactive Areas in 1D Cross-Section - Introduced in v3.4 - if checked, inactive areas on ESTRY cross-section will be shown. Prior to v3.4 inactive areas were always shown.
- Resolution - Deprecated setting since TUFLOW Viewer 3.1.0. Previously this would control the mesh sampling interval along plotting lines (e.g. along a cross-section line). Since 3.1.0 TUFLOW Viewer will calculate mesh intersections with the plotting line and use mid-way points to extract mesh information. This was done to improve extraction from flexible mesh results (e.g. Quadtree and FV). Note: some mesh results store information on the mesh face as opposed to the mesh vertices (mesh face in this context refers to the cell area as opposed to the mesh sides) and TUFLOW Viewer will use the raw mesh face results and not the resampled vertex information. An example of a result dataset that stores results on the mesh face is TUFLOW FV NetCDF map outputs.
- Label Field Index - sets the index (starting at index 1) of the attribute field used for the plot legend when plotting from an existing vector layer.
- Interpolate Vertical Profile - toggles whether the vertical profile plot interpolates between sample points.
- Mean Event Selection - Sets the mean event selection option.
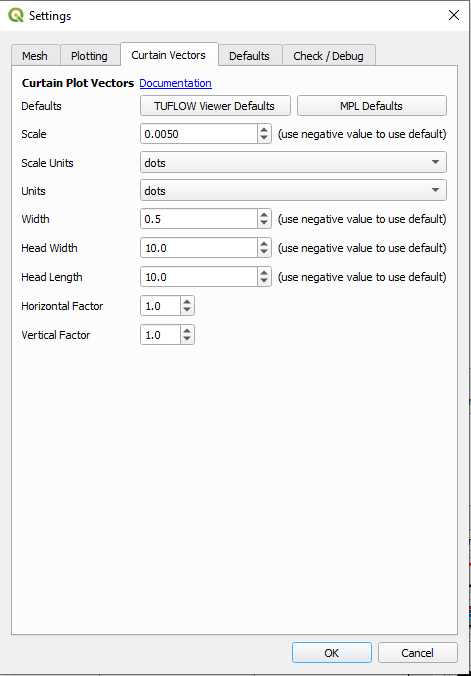
Curtain Vectors
Options are taken directly from the Matplotlib 'Quiver' options, and values input here will be passed directly to the library.
https://matplotlib.org/stable/api/_as_gen/matplotlib.pyplot.quiver.html
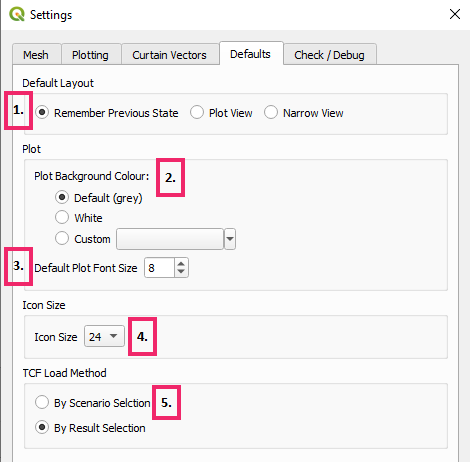
- Default Layout - Sets the default layout that TUFLOW Viewer will use when it is first opened.
- Plot Background Colour - Sets the plot background colour.
- Default Plot Font Size - Sets the default font size for the plot. This will be used for all the axis font sizes and the legend font size.
- Default Icon Size - Sets the icon size within TUFLOW Viewer.
- TCF Load Method - Sets the behaviour of TUFLOW Viewer when loading results from a TCF:
- By Scenario Selection - Only method available prior to v3.3. Gives the user the option to select the desired scenario, event, and output zone (if any of them are present) and TUFLOW Viewer will then try and figure out which results to load based on the selected criteria.
- By Result Selection - Default since v3.3. TUFLOW Viewer will find all results based on the TCF. If there are multiple options, the user will be given the chance to choose the result(s) to load. This method is generally preferred as the original method was a little ambiguous as to which results would actually be loaded. It would also miss scenario names if they were never invoked within an "IF Scenario" block anywhere in the control files.
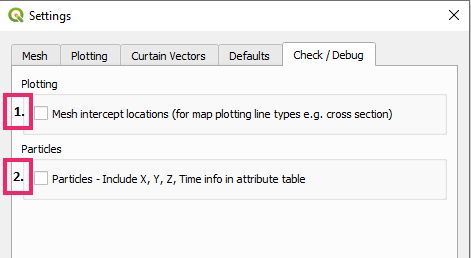
- Mesh Intercept Locations - Outputs mesh intercept points with a plotting line (from any of the plotting types e.g. From Map, From Layer etc). If the mesh layer stores results on the mesh face, the mesh faces are also output (mesh face in this context refers to the cell area as opposed to the mesh sides).
- Particles - Include X, Y, Z, Tin Info - Includes location and time information as attributes for particle outputs. Having this on will slow down particle output rendering.
| Up |
|---|
