Tute M05 Calculate Afflux Arc Archive
Jump to navigation
Jump to search
Introduction
In this page we compare the peak flood levels for the existing and developed case runs to calculate flood afflux. This requires the 3D analyst toolbox. If you do not have this toolbox it will be necessary to calculate the results outside of ArcMap using the TUFLOW utilities. This process is outlined in the tutorial module.
Method
- Open ArcMap and ensure that you have a 3D analyst licence available (if you do not have a 3D analyst licence, the TUFLOW utilities can be used to create the difference raster see here.
- From the TUFLOW\Results\M05\2D\ folder, open both the M05_5m_dev_001_hMax.asc and M05_5m_exg_001_hMax.asc grids. These can simply be dragged and dropped into the layer control or they can be imported using the Conversion >> To Raster >> ASCII to Raster toolbox item.
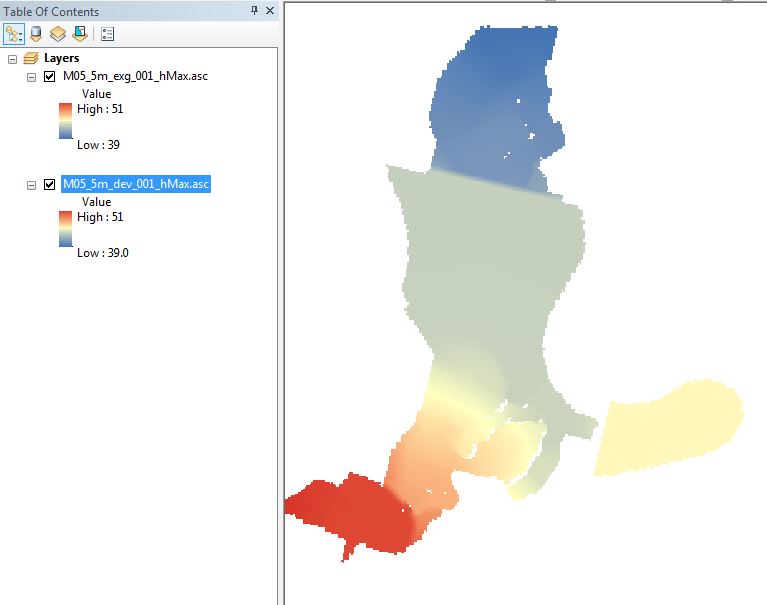
- Once these grids have been opened they can be coloured or interrogated using the standard ArcGIS methods. In the image below they have been shaded.
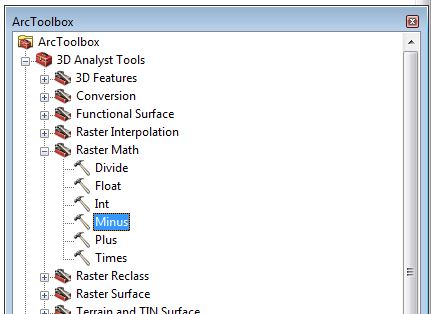
- To calculate the flood impacts we will subtract the existing case results from the developed case. To do the open the 3D Analyst Tools>> Raster Math >> Minus item from the toolboxes:
- At the dialogue, subtract the existing (exg) results from the developed (dev) results to (i.e. impact = dev - exg). This will create a new raster difference grid that can be styled or coloured as desired.


Conclusion
ArcMap has been used to calculate the flood afflux. Please return to Module 5.