Tute M05 Calculate Afflux QGIS Archive
Jump to navigation
Jump to search
Introduction
In this page we compare the peak flood levels for the existing and developed case runs to calculate flood afflux using QGIS. As noted in the tutorial, in order to calculate changes in flood extents you will need to use the the TUFLOW utilities. This process is outlined in the tutorial module.
Method
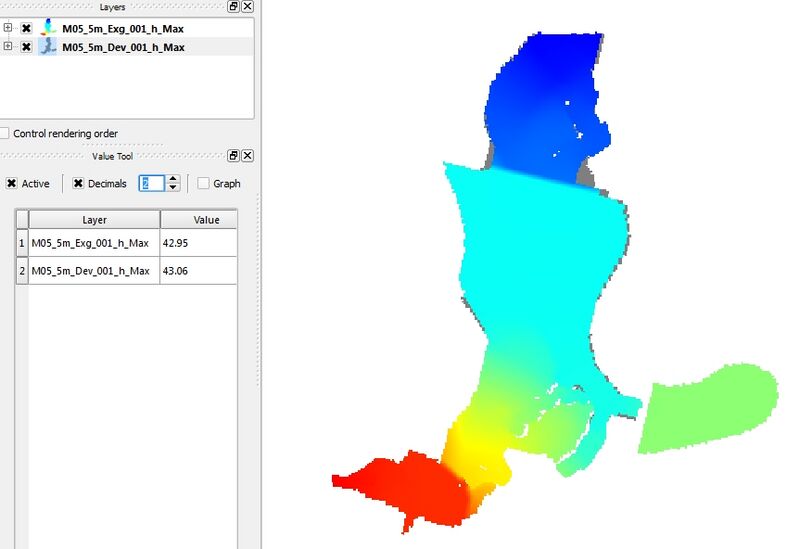
- Open QGIS and from the TUFLOW\Results\M05\2D\ folder, open both the M05_5m_dev_001_hMax.asc and M05_5m_exg_001_hMax.asc grids. These can simply be dragged and dropped into the layer control or they can be opened using the Layers >> Open Raster Layer menu item.
- Once these grids have been opened they can be coloured or interrogated using the standard QGIS functions.
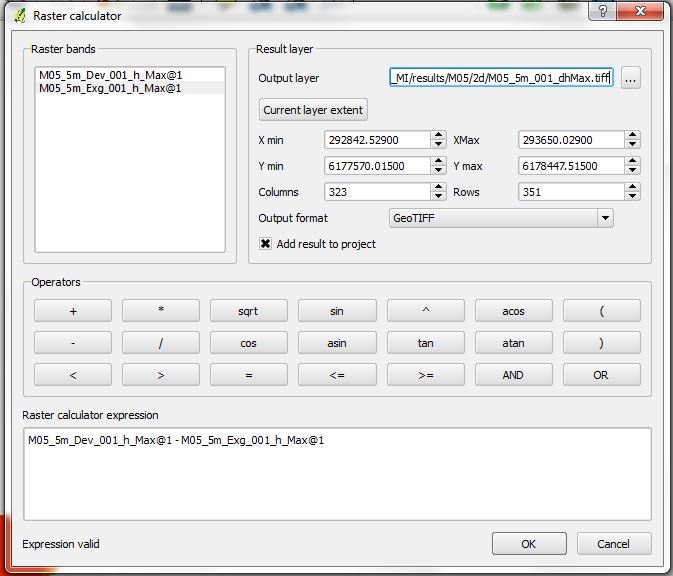
- To calculate the flood impacts we will subtract the existing case results from the developed case. To do the open the Raster >> Raster Calculator item from the menu. At the dialogue subtract the existing (exg) results from the developed (dev) results (i.e. impact = dev - exg). This will create a new raster difference grid that may be styled or coloured as desired.


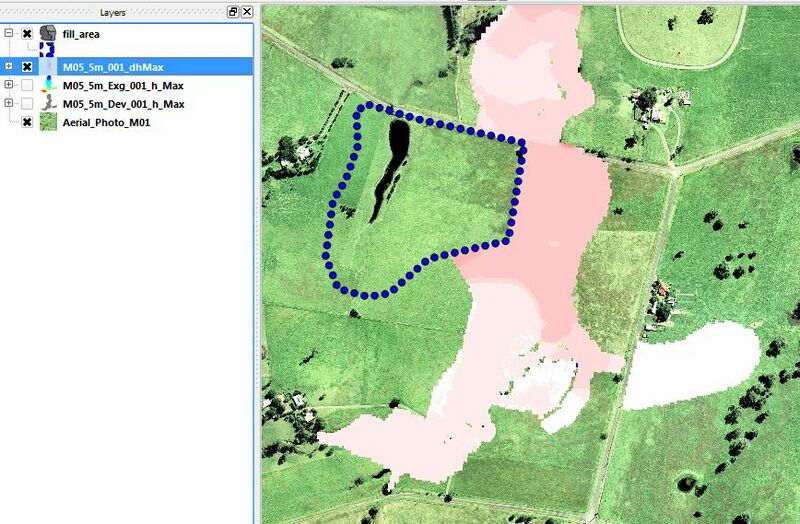
The resulting flood afflux is shown below. Note the lack of difference in the fill area where the existing case scenario was inundated but the developed case was not.
TIP: There are some useful tools such as ColorBrewer or the plugin 1-Band Raster which can help to create a nice colour profile.

Conclusion
QGIS has been used to calculate the flood afflux. Please return to Module 5.