View Results in ArcGIS Archive
- If it is not already open, start ArcMap and load the aerial photo (Module_Data\Aerials\ArcGIS\).
- Firstly we will open the gridded (raster) datasets, to do this select Add Data. Navigate to the TUFLOW\Results\M01\2d\grids\ folder and select the M01_5m_002_d_Max.flt file. You can also drag and drop the .flt file from Windows Explorer onto the Arc Map window to open. The _d in the filename indicates that this is a depth results, the _Max indicates the maximum depth. The M01_5m_002_d_001_55.flt is the depth at 1hr : 55 minutes. The map window should now show the grids over the aerial photo, as per the image below.
- Depending on the verion of ArcMap used, the results are showing up as grey or as a greyscale range. We will give these a colour shading to make the results more meaningful. We will use the M01_5m_002_d_Max to demonstrate how this is done. Turn of the other results layer so that only the M01_5m_002_d_Max and Aerial_Photo_M01 are visible.
- Right click on the M01_5m_002_d_g002.50_Max layer and select properties.
- In the symbology tab, set an appropriate colour-ramp and change the stretch type to "Minimum-Maximum".
- We will now look at the water level results, these have the output name _h. Add the M01_5m_002_h_Max.flt results. Following a similar process as above, enter the properties, in the symbology select the Classified option. In the Classify dialogue you can set the contour increments.
- Download the TUFLOW_to_GIS utility and unzip. Take note of where this utility is located.
- Create an empty text file in the TUFLOW\results\M01\2d\ directory and name the file Process_Results.bat
- Open the text file in a text editor
- Add the following lines to the Process_Results.bat (these can be copied and pasted from below) and then save the batch file:
REM Any text following "REM" is treated as a remark or comment.
REM Process the velocity vectors at times 1, 2 and 3 hours.
C:\TUFLOW\Utilities\TUFLOW_to_GIS.exe -b -shp -vector -t1 M01_5m_002_V.dat
C:\TUFLOW\Utilities\TUFLOW_to_GIS.exe -b -shp -vector -t2 M01_5m_002_V.dat
C:\TUFLOW\Utilities\TUFLOW_to_GIS.exe -b -shp -vector -t3 M01_5m_002_V.dat
Pause REM this keeps the Command Window open after processing
Update the path to TUFLOW_to_GIS.exe if necessary.
- In Windows Explorer navigate to the TUFLOW\results\M01\2d\ directory and double click on the newly created batch file Process_Results.bat. A console window should appear and the batch file may process for a minute or so. When finished the output screen should look like screen image below:
- The vector outputs from the TUFLOW_to_GIS conversion can be directly loaded into ArcMap.
- Select the three velocity vector results, from the TUFLOW\results\M01\2d\ directory.
- M01_5m_002_V____1.00(v)_R
- M01_5m_002_V____2.00(v)_R
- M01_5m_002_V____3.00(v)_R
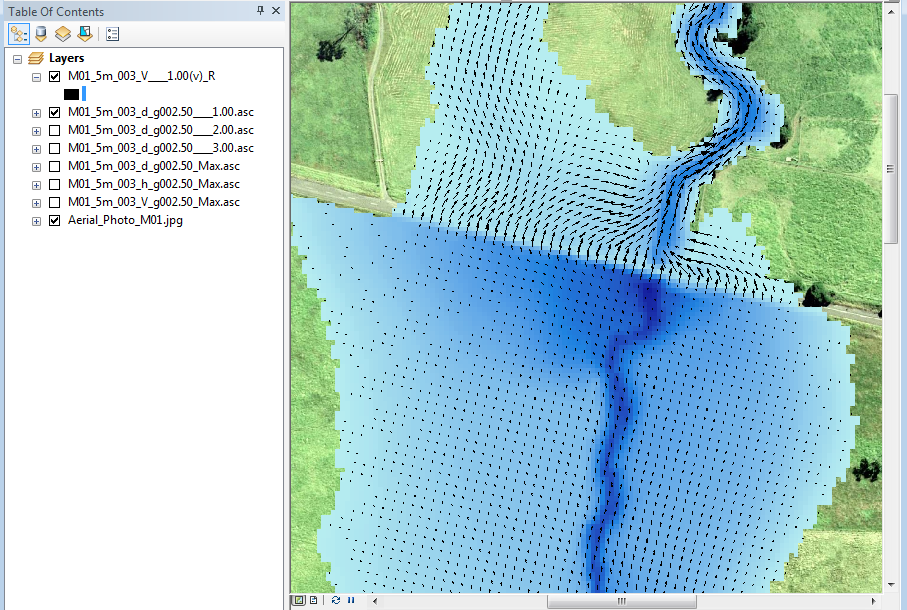
- Turn all layers off except the aerial photo, M01_5m_002_d_g002.50____1.00 (the depth at time 1 hour) and the M01_5m_002_V____1.00(v)_R (velocity vector at time 1 hour).
- Colour the depth grid, using the method above.
- Repeat the process above to view the results at 2 and 3 hours into the simulation.
Introduction
In this section we will look at post-processing the TUFLOW results so they can be imported and viewed in ArcGIS. We will load 3D surfaces (as gridded datasets) as well as point and vector data (as region objects).
Rasters


When applied the results should now be shaded with low depths shown in light blue and deeper water as a dark blue, as per the image below.


Vectors
TUFLOW to GIS
In order to bring the vector data into ArcGIS as arrows, it is necessary to utilise a TUFLOW utility called TUFLOW_to_GIS.exe this utility can be downloaded from the TUFLOW website (TUFLOW Downloads).
There is separate wiki page on how to use the TUFLOW_to_GIS utility. This page can be found here TUFLOW to GIS.

Viewing in ArcMap
Vector Results

For those progressing through the Tutorial Module 1, you can return to the tutorial module here.