View Results in MapInfo Archive
Introduction
MapInfo can be used to view both the scalar datasets (such as depths, levels and velocity magnitudes). These can directly be output from TUFLOW using Grid output format.
For the old page which steps through the process of using TUFLOW_to_GIS to convert these please see View Results in MapInfo (TUFLOW_to_GIS)
Rasters
The raster grids should have been written to the following directory: TUFLOW\Results\M01\2D\grids\. If this folder does not contain a series of .asc grids, please check that:
- The Map Output Format == GRID has been specified in the .tcf.
- The following is included in the .tcf: Grid Format == ASC
If the Grid Format command is not specified, TUFLOW will output to the default .flt format, which Vertical Mapper does not recognise.
Import to MapInfo
- In MapInfo bring up the Grid Import dialogue by selecting the following menu items Vertical Mapper >> Create Grid >> Import Grid.
- Select Add... and then navigate to the TUFLOW\Results\M01\2D\grids\ directory. To import all grids, select all of the .asc files (by holding down the shift key) and then select Open.
- If prompted, select the Category: Universal Transverse Mercator (WGS 84) and the category member UTM Zone 60, Southern hemisphere (WGS 84). Check the Use for all imports of similar type checkbox, as per the image below.
- When prompted select the Z-Units for the import to Metres and check the Use for all imports of similar type checkbox, as per the image below.
- The grid import window should now look like the image below. Select OK to import all of the results grids.
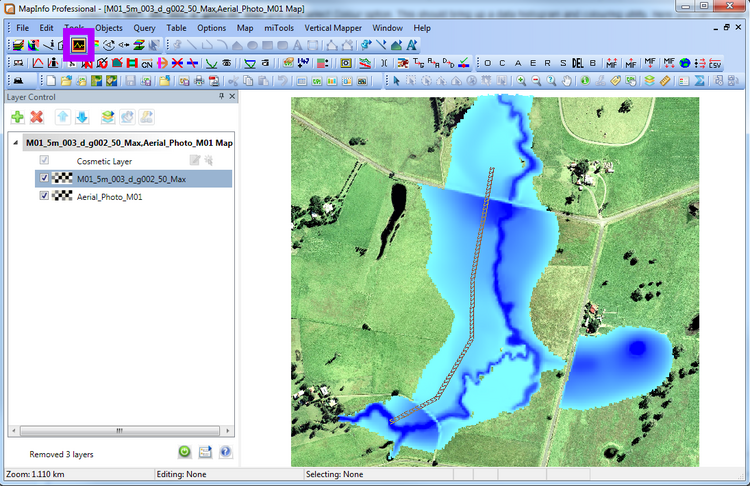
- Turn on the aerial photo and the maximum depth grid (M01_5m_002_d_g002.50_Max)
- Do do this select the Grid Info icon (highlighted in the toolbar in the image below) and click in the Map Window. A new window titled Grid Info should appear and list the values in the active grids.
- In the Grid Manager, Uncheck the Grid Info for all grids except the M01_5m_002_h_g002.50_Max (maximum water level) To create a long section of the water level results. The Vertical Mapper Cross-Section utility can be used. The icon for this is highlight in the image below.
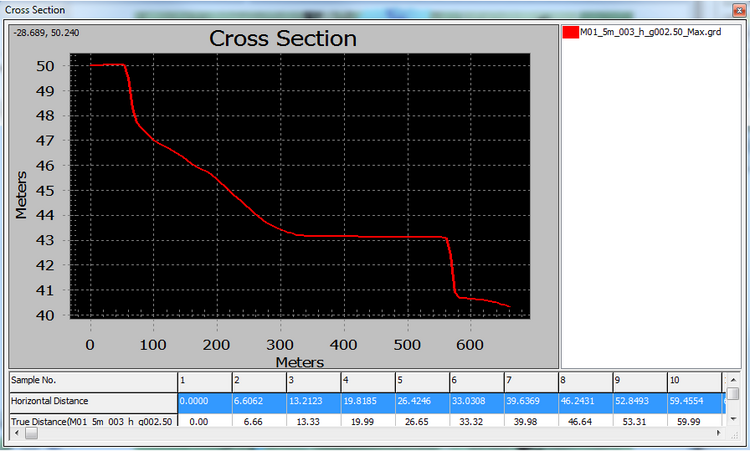
- Select the Cross-Section tool and draw a polyline from the upper inflow boundary to the downstream boundary. Double click to terminate the line. A section window should appear.
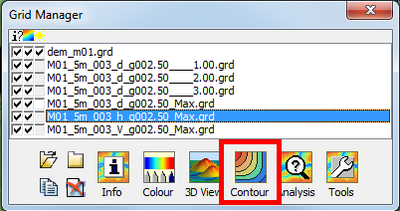
A grid can also be contoured into regions or lines. To create contours of the maximum water levels, select the grid in the Grid manager dialogue and select the Contour button. This is highlighted in the image below.
- To create 0.5m interval contour lines, in the contour dialogue (see image below), make the following changes:
- Ensure that the Grid: is the water level (M01_5m_002_h_g002.50_Max)).
- Select Polylines (the default is Regions).
- Select the Intervals And set a minimum of 38, a maximum of 50.5 and an interval of 0.5.
- Give the output a sensible file name (I have used M01_5m_002_hMax_Lines)
TIP: The Gradient... option can be used to change the colour profile. - Select Ok to begin the contouring.


Viewing Surfaces

To change the styling of the visible layer, bring up the Vertical Mapper Grid Manager, this can be done by selecting the menu item Vertical Mapper >> Show Grid Manager.

Select the M01_5m_002_d_g002.50_Max grid and select Colour option. This should bring up a data histogram and colouring utility. Here you can change the colouring options.
TIP: Once you have a colour profile you are happy with this can be saved, so it can be applied to other grids.

The value from the TUFLOW results can be inspected at any point by using the Vertical Mapper Grid Info utility.

To control which grids information is displayed for, in the Grid Manager window, use the check box under the i? (first column).


TIP: Use the Save As... and Load... options, to contour multiple grids to the same interval and styling.

Once completed (this should only take a few seconds), a new table containing the contour lines will be created. This can be added to a map and labelled using either of the label buttons, highlighted in the image below. The button within the Layer Control (to the right of the table name) will label all lines, the button in the toolbar allows the user to select lines to be labelled. To change the label propoerties, right click on the table in the Layer Control and select layer properties, select Label Display to change the labelling options.

Vectors
TUFLOW to GIS
In order to view the vectors, rather than the scalar grided datasets, it is necessary to use the TUFLOW to GIS utility. This utility can be downloaded from the TUFLOW website (TUFLOW Downloads).
There is a separate wiki page on how to use the TUFLOW_to_GIS utility. This page can be found here TUFLOW to GIS.
- Download the TUFLOW_to_GIS utility and unzip. Take note of where this utility is located.
- Create an empty text file in the TUFLOW\results\M01\2d\ directory and name the file Process_Results.bat
- Open the text file in a text editor
- Add the following lines to the Process_Results.bat (these can be copied and pasted from below) and then save the batch file:
REM Process the velocity vectors at times 1, 2 and 3 hours.
C:\TUFLOW\Utilities\TUFLOW_to_GIS.exe -b -mif -vector -t1 M01_5m_002_V.dat
C:\TUFLOW\Utilities\TUFLOW_to_GIS.exe -b -mif -vector -t2 M01_5m_002_V.dat
C:\TUFLOW\Utilities\TUFLOW_to_GIS.exe -b -mif -vector -t3 M01_5m_002_V.dat
Update the path to TUFLOW_to_GIS.exe if necessary.
- In Windows Explorer navigate to the TUFLOW\results\M01\2d\ directory and double click on the newly created batch file Process_Results.bat. A console window should appear and the batch file may process for a minute or so. When finished the output screen should look like screen image below:
- To import the velocity vectors use the Table >> Import to import the three .mif files produced. These must be imported one at a time. Tip: A batch import function is available in the miTools utilities. Using the Layer Control you can turn on the various results files.
- To view the depth (grid) and velocity vectors at time 1 hour in the model simulation. In layer control add the following M01_5m_002_d_g002.50____1.00 (depth at time 1hr) and M01_5m_002_V____1.00_v (velocity vectors at time 1hr) to the aerial photo.

Import Vectors
Viewing Vectors
The vectors are MapInfo tables containing the arrows as polygon objects. These can simply be added to any map window, these will need to appear above the aerial photos and results grids to be visible.
The info tool (green i) can be used to interrogate the velocity at each vector location, to determine the velocity magnitude.

To view the results at different times, simply add and remove the grids and velocity results for the appropriate time. For example remove (or turn off the visibility) of M01_5m_002_d_g002.50____1.00 and M01_5m_002_V____1.00_v and add M01_5m_002_d_g002.50____2.00 and M01_5m_002_V____2.00_v to view the depth and velocity at output time 2 hours.
Conclusion
In this page we have introduced TUFLOW_to_GIS for processing of TUFLOW results into MapInfo format. These results have been imported into MapInfo for viewing. We have also covered:
- Changing the colour profile of a results grid
- Point inspecting results
- Taking profiles of results
- Contouring of results
For those progressing through the Tutorial Module 1, you can return to the tutorial module here.