VM Create Grid
Jump to navigation
Jump to search
- From the menu items select Vertical Mapper >> Create Grid >> Interpolation.
- Select an interpolation method, see the MapInfo documentation for more details. For creating a DEM from a _zpt_check file I use Triangulation with smoothing.
- Select the table and column for the data you want to grid. File:VM grid interpolation2.png|none|frame|Select Data to Interpolate]]
- Set the grid interpolation parameter, this depends on the method selected above, for triangulation of a zpt_check file, set the Maximum Triangle Side Length to be just less than your largest cell size (this ensures that you don't get triangulation across gaps in data).
-
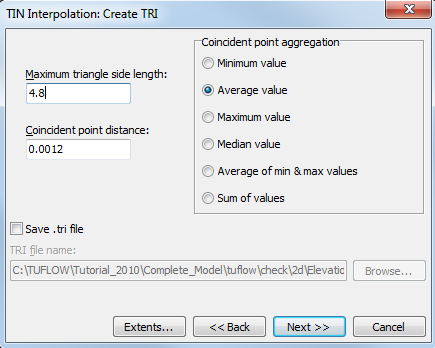 Set Triangulation Options
Depending on the number of points the interpolation could take a few minutes.
- Follow the prompts and set a cell size and name for the output grid. If using triangulation I set a Linear Solution.
Introduction
This is an excellent way of visualising check files such as the _zpt_check.mif that is written by TUFLOW. This check file is outputted after all elevation data and topography modifiers (breaklines, z zhapes etc) have been processed. This method can also be applied to other data, such as survey data to create a DEM.
Method

Select Method for Grid Interpolation


Set Cell Size and Output Name
A grid should now be processed and displayed, to enable relief shading see this page.

Final DEM (of the _zpt_check.mif for TUFLOW tutorial module 1)