Difference between revisions of "1D Pumps"
Rohan.king (talk | contribs) |
Ellis Symons (talk | contribs) |
||
| (105 intermediate revisions by 4 users not shown) | |||
| Line 1: | Line 1: | ||
| − | |||
| − | |||
| − | |||
| − | |||
=Introduction= | =Introduction= | ||
| − | This post provides a modelling example for a 1D pump using a | + | This post provides a modelling example for a 1D pump using a pump curve. For this example we will set up a pump in two common situations (2D-2D & 1D-2D). |
| + | |||
=Pump Attributes= | =Pump Attributes= | ||
| − | + | A pump needs to first be digitised in a 1d_nwke layer. The direction of the polyline must go from inlet to outlet as a pump is unidirectional (see Section 5.9.2.1 Pumps). The attributes required for a pump in your 1d_nwk layer can be found within the 2018 TUFLOW manual.<br> | |
| − | + | In the 1d_nwk layer, the following attributes are required:<br> | |
| − | + | #ID = ID of the pump channel. <br> | |
| − | + | #Type = "P" or "PO". <br> | |
| − | + | #US_Invert = Intake elevation of the pump. <br> | |
| − | + | #DS_Invert = Outlet elevation of the receptor. <br> | |
| − | + | #Inlet_Type = Used to specify the pump curve in the Depth Discharge database. <br> | |
| − | + | #Width_or_D = Diameter of the pump’s outlet pipe/hose. <br> | |
| − | + | #Number_of = Number of (identical) pumps. | |
| + | <br> | ||
| + | [[File:1d_nwk_pump_pipe.PNG|border|300px]] <br> | ||
| + | |||
=2D-2D Configuration= | =2D-2D Configuration= | ||
| − | + | Because pumps are zero length channels they do not create automatic nodes at the upstream and downstream end. If you ran the model with just a pump polyline and SX connection you will get [[TUFLOW_Message_1353| <font color="red"><tt>ERROR 1353 - No NA data for Node</tt></font><tt>.</tt>]]To remove this error, the most efficient schematisation is to digitise a 1d_nwk 'NODE' at the upstream and downstream end of the pump (no need for a separate 2d_bc SX layer). The 'NODE' requires a nominal storage amount in the “Len_or_NA” attribute, in addition infill 'SX' into the "Conn_1D_2D" attribute to connect the 1d pump to the 2D domain. SX connections are required at connections to 2D domains to transfer water from the 1D node to the 2D. Without the SX connection, water will build up within the node and cause an instability. See the example below.<br> | |
| − | + | ||
| − | + | [[File:1d_nwk_pump_SX_node.PNG|border|300px]] <br> | |
| − | + | ||
| − | + | A simple 2D-2D pump configuration will look like the below schematisation. <br> | |
| + | |||
| + | [[File:Pump_schematic.PNG|border|600px]] <br> | ||
| + | |||
=1D-2D Configuration= | =1D-2D Configuration= | ||
| − | Connecting a pump from a 1d network to the 2d domain or vice versa is similar to the configuration above, the only difference is that the connection with a 1d structure does not require a | + | Connecting a pump from a 1d network to the 2d domain or vice versa is similar to the configuration above, the only difference is that the connection with a 1d structure does not require a 1d nwk ‘Node’. A storage chamber in the 1d network can also be modelled using a 1d_na node with an elevation vs area .csv assigned to the node. <br> |
| − | [[File:1D- | + | [[File:1D-2D_pump_schematisation.PNG|border|600px]] <br> |
=Estry Control File Setup= | =Estry Control File Setup= | ||
| − | Within the *.ecf the following commands and files are | + | Within the *.ecf the following commands and files are required to run a pump with no logical controls:<br> |
| − | <br> | ||
<font color="blue"><tt>Read GIS Network</tt></font> <font color="red"><tt>==</tt></font><tt>..\model\mi\1d_nwke_xxxxx.MIF</tt><br> | <font color="blue"><tt>Read GIS Network</tt></font> <font color="red"><tt>==</tt></font><tt>..\model\mi\1d_nwke_xxxxx.MIF</tt><br> | ||
<font color="blue"><tt>Depth Discharge Database</tt></font> <font color="red"><tt>==</tt></font><tt>..\bc_dbase\xxxxx.csv</tt><br> | <font color="blue"><tt>Depth Discharge Database</tt></font> <font color="red"><tt>==</tt></font><tt>..\bc_dbase\xxxxx.csv</tt><br> | ||
| − | + | If you do not specify a Depth-Discharge database then you will be faced with <font color="red"><tt>ERROR 1118 – Could not find a y-Q curve</tt></font><tt>.</tt><br> | |
| − | If you do not specify a Depth-Discharge database then you will be faced with <font color=" | + | |
| − | + | =TUFLOW Operating Control File (.TOC)= | |
| − | + | For guidance on setting up the operating controls for pumps, see section 5.9. in the latest TUFLOW Manual. <br> | |
| − | + | ||
| + | .ecf command required: <br> | ||
| − | + | <font color="blue"><tt>Read Operating Controls File</tt></font> <font color="red"><tt>==</tt></font><tt> xxxxx.toc</tt><br> | |
| − | |||
| − | |||
| − | |||
| − | |||
| − | |||
| − | |||
| − | |||
| − | |||
| − | |||
| − | |||
| − | |||
| − | |||
| − | |||
| − | |||
| − | |||
| − | |||
| − | |||
| − | |||
| − | |||
| − | |||
| − | |||
| − | |||
| − | |||
| − | |||
| − | |||
| − | |||
| − | |||
| − | |||
| − | |||
| − | |||
| − | |||
| − | |||
| − | |||
| − | |||
| − | |||
| − | |||
| − | |||
| − | |||
| − | |||
| − | |||
| − | |||
| − | |||
| − | |||
| − | |||
| − | |||
| − | |||
| − | |||
=Depth Discharge Database= | =Depth Discharge Database= | ||
| − | == | + | The depth discharge database is set up in the same way as a pit inlet database, see 5.12.4 in the TUFLOW manual. Each pump ‘Inlet_type’ must reference a name within the depth discharge database, otherwise [[TUFLOW_Message_1118 | <font color="red"><tt>ERROR 1118 - Could not find pit inlet type ",a," in the pit inlet database</tt></font><tt></tt>]]. The ‘Area (m2)’ column is the area of the pump offtake and ‘Width (m)’ column is the width of the pump offtake. Without information in the Area(m2) or Width(m) columns in the depth discharge database <font color="red"><tt>Error 1092</tt></font><tt></tt> and <font color="red"><tt>Error 1093</tt></font><tt></tt> will appear. <br> |
| − | The | + | |
| − | + | ==Pump Curve== | |
| + | The performance of pumps is a function of suction head at the inlet and the level of the discharge location. The resultant total head between the water level at the inlet and outlet is what determines the flow rate through the pump. If the suction level is low the pump will need to provide more energy in the form of pressure to maintain the water elevation at the outlet, the opposite is also true if the water depth at the pump inlet is high. <br> | ||
| + | |||
| + | [[File:pump_fundamentals_total_head.jpg|thumb|none|500px|www.pumpfundamentals.com]] | ||
| − | + | That being the case it is important to consider what total head is required to achieve the modelling objectives and what flow rates you may require. Once you have an idea on any limits in total head you can start to research an appropriate pump and then extract the performance curve that is often incorporated as part of the technical specifications. An example is shown below. <br> | |
| − | |||
| − | |||
| − | |||
| − | |||
| − | |||
| − | |||
| − | |||
| − | |||
| − | |||
| − | |||
| − | |||
| − | |||
| − | |||
| − | |||
| − | |||
| − | |||
| − | |||
| − | |||
| − | |||
| − | |||
| − | |||
| − | |||
| − | |||
| − | |||
| − | |||
| − | |||
| − | |||
| − | |||
| − | |||
| − | |||
| − | |||
| − | |||
| − | |||
| − | |||
| − | |||
| − | |||
| − | |||
| − | |||
| − | + | [[File:Manufacturer pump curve.JPG|border|600px]] | |
| − | |||
| − | |||
| − | |||
| − | |||
| − | |||
| − | |||
| − | |||
| − | |||
==Creating a TUFLOW pump curve== | ==Creating a TUFLOW pump curve== | ||
| − | The | + | The setup of the Depth Discharge database for a pump curve is similar to reading in inflow hydrographs, hyetographs etc, that is; a source .csv, and the two corresponding headings within the 3rd and 4th column. <br> |
| + | |||
| + | [[File:depth-discharge_pump.PNG |border|500px]] <br> | ||
| + | |||
| + | Once you have your manufacturer curve for your given pump it is now necessary to create the curve .csv for TUFLOW to read in. The manufacturer specifications will need to be translated into a total head vs pump rate chart. Although reading in the depth discharge database is the same process as other boundary conditions within TUFLOW, the curve itself is fundamentally different as you no longer need to start the csv file with 0,0. If the curve did start at 0,0 this would not make sense because at a total head difference of 0m the pump should effectively be operating at peak performance so the flow rate would be greater than 0 m3. The image below shows a csv file for the pump performance curve given in the previous section. <br> | ||
| + | <br> | ||
| + | [[File:Pump_curve_csv_example.png|border|600px]] <br> | ||
| + | |||
| + | ==Using a Pump Curve in a TUFLOW Operating Control (TOC) File== | ||
| + | |||
| + | With the pump curve defined in the depth-discharge database it can either be specified within the pump 1d_nwk fields in the inlet_type field, for non-operational pumps, or it can be defined with the TOC file, for operational pumps. When defining with a TOC file, the pump curve is defined at the top of the structure control definition block and then the subsequent rules can turn the pump on/off. See the below TOC structure control definition for an example. In this case, the pump curve is used when the pump switches on once upstream water levels reach 2.75m AD. The pump curve is then used until the upstream water levels are reduced to 2.25m AD at which point the pump is switched off. | ||
| + | |||
| + | <font color="blue"><tt>Define Pump Control</tt></font><font color="red"><tt> ==</tt></font> Pump_1 | ||
| + | <font color="blue"><tt>Pump Capacity</tt></font><font color="red"><tt> ==</tt></font> pump_1 | ||
| + | HU <font color="red"><tt>==</tt></font> H1D Pump1.1 | ||
| + | <font color="blue"><tt>If </tt></font>HU <= 2.25 | ||
| + | <font color="blue"><tt>Pump Operation</tt></font><font color="red"><tt> ==</tt></font> Off | ||
| + | <font color="blue"><tt>Else if</tt></font> HU > 2.25 <font color="blue"><tt>AND</tt></font> HU < 2.75 | ||
| + | <font color="blue"><tt>Pump operation</tt></font><font color="red"><tt> ==</tt></font> <font color="blue"><tt> No Change </tt></font> | ||
| + | <font color="blue"><tt>Else if</tt></font> HU <font color="red"><tt>>=</tt></font> 2.75 | ||
| + | <font color="blue"><tt>Pump Operation</tt></font><font color="red"><tt> ==</tt></font> On | ||
| + | <font color="blue"><tt>End if</tt></font> | ||
| + | <font color="blue"><tt>End define</tt></font> | ||
| + | |||
| + | =1D Result File= | ||
| + | Although strictly not a check file, the operation of the pump can be confirmed by opening the *_1d_O.csv which is found within the csv folder where the results are written. The *_1d_O.csv monitors the operation of structures, this file can be quite useful in checking how the structure is performing with the given .toc file and GIS inputs. <br> | ||
{| align="center" class="wikitable" width="75%" | {| align="center" class="wikitable" width="75%" | ||
| − | |||
! style="background-color:#005581; font-weight:bold; color:white;"| Filename prefix / suffix | ! style="background-color:#005581; font-weight:bold; color:white;"| Filename prefix / suffix | ||
! style="background-color:#005581; font-weight:bold; color:white;" width=75%| Brief Description | ! style="background-color:#005581; font-weight:bold; color:white;" width=75%| Brief Description | ||
|- | |- | ||
| − | | [[ | + | | [[Pump_Results_1d_O | _1d_O.csv]]|| This csv displays the status of the pump, whether that is closed or fully open, results for any logic parameter specified in the TOC file and the flow through the pump if it is in operation. |
|} | |} | ||
| − | + | <br> | |
| − | Any further questions please email TUFLOW support: [mailto:support@tuflow.com support@tuflow.com] | + | Any further questions please email TUFLOW support: [mailto:support@tuflow.com?Subject=TUFLOW%201D%20pumps%20help support@tuflow.com] |
| + | <br><br> | ||
| + | {{Tips Navigation | ||
| + | |uplink=[[ TUFLOW 1D Channels and Hydraulic Structures | Back to 1D Channels and Hydraulic Structures]] | ||
| + | }} | ||
Latest revision as of 18:07, 27 November 2023
Introduction
This post provides a modelling example for a 1D pump using a pump curve. For this example we will set up a pump in two common situations (2D-2D & 1D-2D).
Pump Attributes
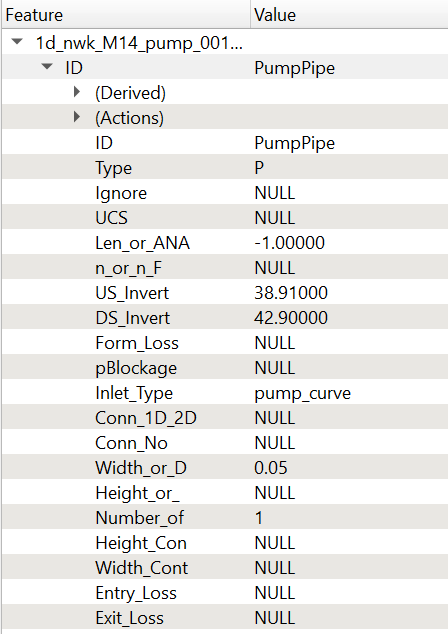
A pump needs to first be digitised in a 1d_nwke layer. The direction of the polyline must go from inlet to outlet as a pump is unidirectional (see Section 5.9.2.1 Pumps). The attributes required for a pump in your 1d_nwk layer can be found within the 2018 TUFLOW manual.
In the 1d_nwk layer, the following attributes are required:
- ID = ID of the pump channel.
- Type = "P" or "PO".
- US_Invert = Intake elevation of the pump.
- DS_Invert = Outlet elevation of the receptor.
- Inlet_Type = Used to specify the pump curve in the Depth Discharge database.
- Width_or_D = Diameter of the pump’s outlet pipe/hose.
- Number_of = Number of (identical) pumps.
2D-2D Configuration
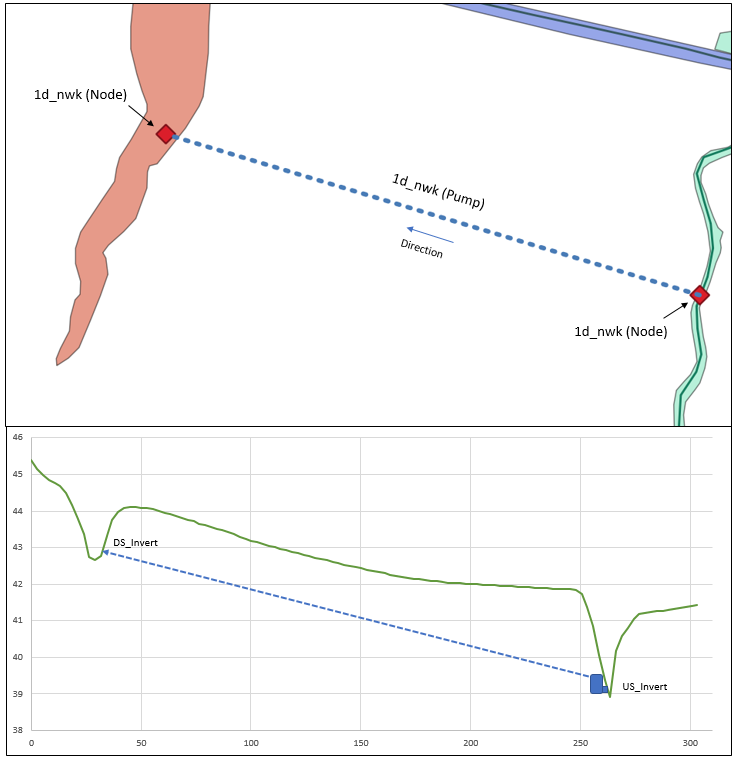
Because pumps are zero length channels they do not create automatic nodes at the upstream and downstream end. If you ran the model with just a pump polyline and SX connection you will get ERROR 1353 - No NA data for Node.To remove this error, the most efficient schematisation is to digitise a 1d_nwk 'NODE' at the upstream and downstream end of the pump (no need for a separate 2d_bc SX layer). The 'NODE' requires a nominal storage amount in the “Len_or_NA” attribute, in addition infill 'SX' into the "Conn_1D_2D" attribute to connect the 1d pump to the 2D domain. SX connections are required at connections to 2D domains to transfer water from the 1D node to the 2D. Without the SX connection, water will build up within the node and cause an instability. See the example below.
A simple 2D-2D pump configuration will look like the below schematisation.
1D-2D Configuration
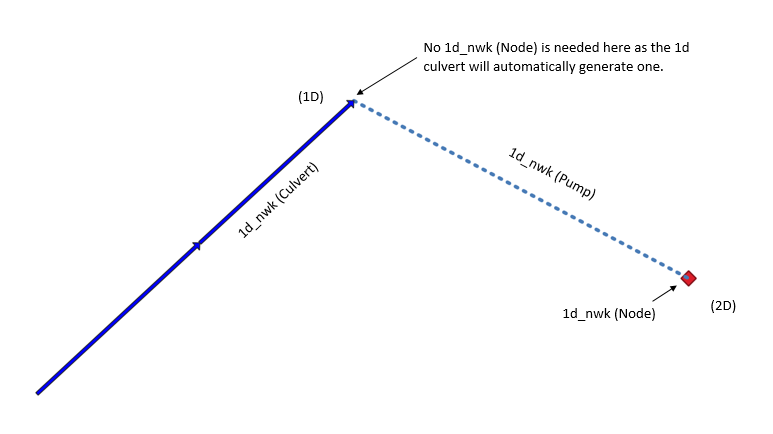
Connecting a pump from a 1d network to the 2d domain or vice versa is similar to the configuration above, the only difference is that the connection with a 1d structure does not require a 1d nwk ‘Node’. A storage chamber in the 1d network can also be modelled using a 1d_na node with an elevation vs area .csv assigned to the node.
Estry Control File Setup
Within the *.ecf the following commands and files are required to run a pump with no logical controls:
Read GIS Network ==..\model\mi\1d_nwke_xxxxx.MIF
Depth Discharge Database ==..\bc_dbase\xxxxx.csv
If you do not specify a Depth-Discharge database then you will be faced with ERROR 1118 – Could not find a y-Q curve.
TUFLOW Operating Control File (.TOC)
For guidance on setting up the operating controls for pumps, see section 5.9. in the latest TUFLOW Manual.
.ecf command required:
Read Operating Controls File == xxxxx.toc
Depth Discharge Database
The depth discharge database is set up in the same way as a pit inlet database, see 5.12.4 in the TUFLOW manual. Each pump ‘Inlet_type’ must reference a name within the depth discharge database, otherwise ERROR 1118 - Could not find pit inlet type ",a," in the pit inlet database. The ‘Area (m2)’ column is the area of the pump offtake and ‘Width (m)’ column is the width of the pump offtake. Without information in the Area(m2) or Width(m) columns in the depth discharge database Error 1092 and Error 1093 will appear.
Pump Curve
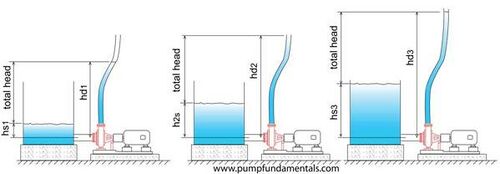
The performance of pumps is a function of suction head at the inlet and the level of the discharge location. The resultant total head between the water level at the inlet and outlet is what determines the flow rate through the pump. If the suction level is low the pump will need to provide more energy in the form of pressure to maintain the water elevation at the outlet, the opposite is also true if the water depth at the pump inlet is high.
That being the case it is important to consider what total head is required to achieve the modelling objectives and what flow rates you may require. Once you have an idea on any limits in total head you can start to research an appropriate pump and then extract the performance curve that is often incorporated as part of the technical specifications. An example is shown below.
Creating a TUFLOW pump curve
The setup of the Depth Discharge database for a pump curve is similar to reading in inflow hydrographs, hyetographs etc, that is; a source .csv, and the two corresponding headings within the 3rd and 4th column.
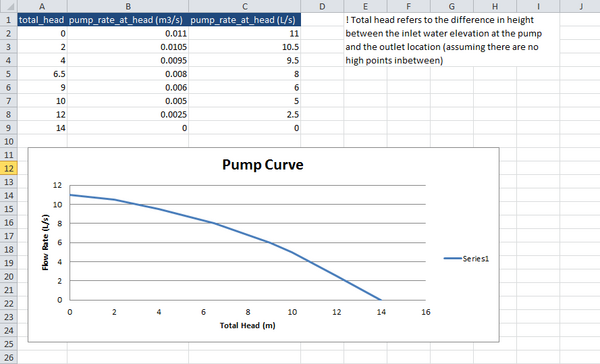
Once you have your manufacturer curve for your given pump it is now necessary to create the curve .csv for TUFLOW to read in. The manufacturer specifications will need to be translated into a total head vs pump rate chart. Although reading in the depth discharge database is the same process as other boundary conditions within TUFLOW, the curve itself is fundamentally different as you no longer need to start the csv file with 0,0. If the curve did start at 0,0 this would not make sense because at a total head difference of 0m the pump should effectively be operating at peak performance so the flow rate would be greater than 0 m3. The image below shows a csv file for the pump performance curve given in the previous section.
Using a Pump Curve in a TUFLOW Operating Control (TOC) File
With the pump curve defined in the depth-discharge database it can either be specified within the pump 1d_nwk fields in the inlet_type field, for non-operational pumps, or it can be defined with the TOC file, for operational pumps. When defining with a TOC file, the pump curve is defined at the top of the structure control definition block and then the subsequent rules can turn the pump on/off. See the below TOC structure control definition for an example. In this case, the pump curve is used when the pump switches on once upstream water levels reach 2.75m AD. The pump curve is then used until the upstream water levels are reduced to 2.25m AD at which point the pump is switched off.
Define Pump Control == Pump_1
Pump Capacity == pump_1
HU == H1D Pump1.1
           If HU <= 2.25
                     Pump Operation == Off
           Else if  HU > 2.25  AND HU < 2.75
                     Pump operation ==  No Change
           Else if HU >= 2.75
                     Pump Operation == On
           End if
End define
1D Result File
Although strictly not a check file, the operation of the pump can be confirmed by opening the *_1d_O.csv which is found within the csv folder where the results are written. The *_1d_O.csv monitors the operation of structures, this file can be quite useful in checking how the structure is performing with the given .toc file and GIS inputs.
| Filename prefix / suffix | Brief Description |
|---|---|
| _1d_O.csv | This csv displays the status of the pump, whether that is closed or fully open, results for any logic parameter specified in the TOC file and the flow through the pump if it is in operation. |
Any further questions please email TUFLOW support: support@tuflow.com
| Up |
|---|
