QGIS 3D Animations: Difference between revisions
No edit summary |
No edit summary |
||
| (30 intermediate revisions by 2 users not shown) | |||
| Line 1: | Line 1: | ||
=Introduction= |
=Introduction= |
||
This page |
This page outlines the process for creating a 3D animation using QGIS. QGIS version 3.34.1 has been used for this example. |
||
== |
==Required Data== |
||
To create a 3D animation in QGIS, the following files are required as a minimum:<br> |
|||
As a minimum you will need:<br> |
|||
* Digital Elevation Model (DEM) |
* Digital Elevation Model (DEM) or TIN; and |
||
* 2D Model Results. |
* 2D Model Results. |
||
'''Note:''' Additional files may also be used to enhance the animation. <br> |
|||
| ⚫ | |||
| ⚫ | |||
<br> |
<br> |
||
=Method= |
|||
| ⚫ | |||
==Configure the QGIS Workspace== |
|||
The following steps demonstrate how to display the water level (_h) datasets, these steps may equally be followed using other datasets you may have. |
|||
Configure the QGIS workspace and display the depth (d) datasets. The same process can be followed for other output datasets. |
|||
<ol> |
<ol> |
||
<li>Load the '''DEM.tif''' into the QGIS workspace. |
|||
| ⚫ | <li> |
||
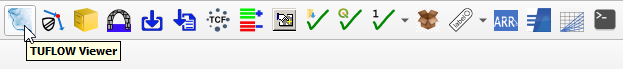
<li>Open the TUFLOW Viewer from the TUFLOW plugin toolbar: <br> |
|||
| ⚫ | |||
| ⚫ | |||
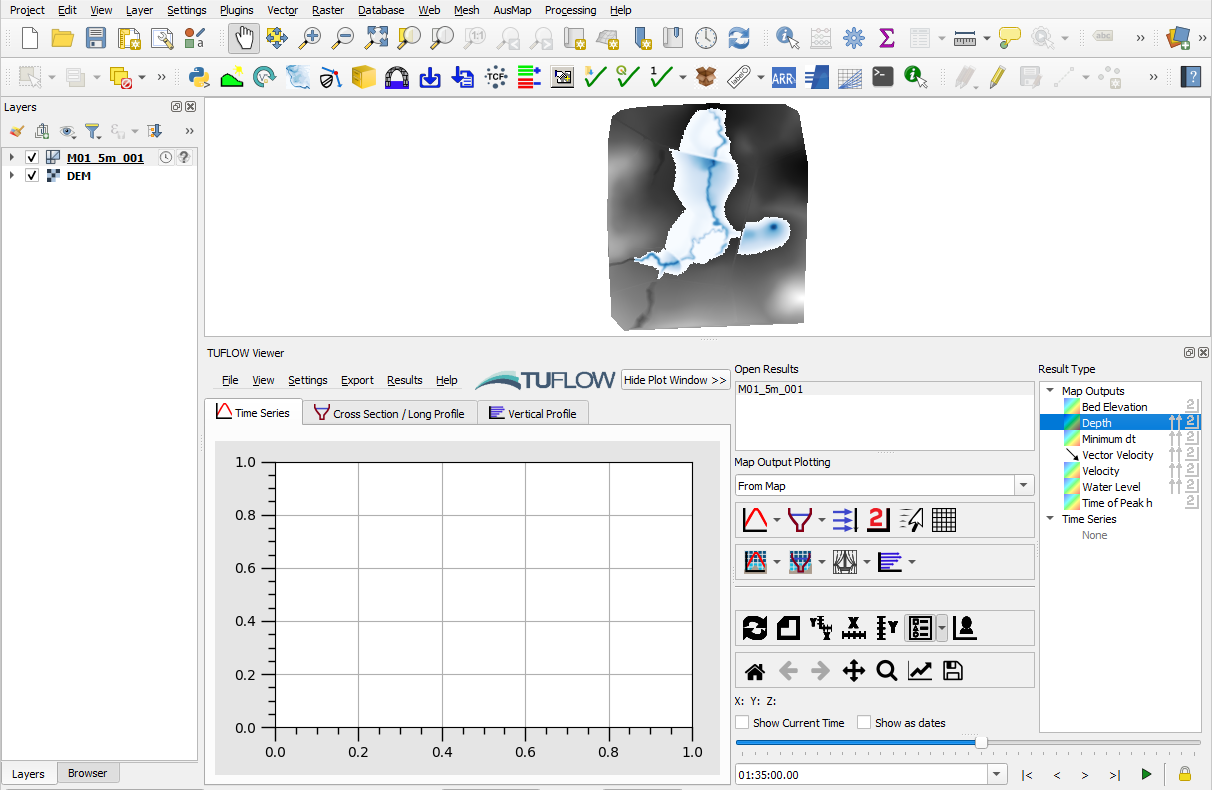
<br>The QGIS workspace should look similar to below: |
|||
[[File:tuflow_plugin_tuflow_viewer.png]]<br> |
|||
<br> |
|||
| ⚫ | <li> Open the 2D model results. Go to 'File' > 'Load Results - Map Outputs' from the TUFLOW Viewer menu options and navigate to the '''*.xmdf''' results file (e.g. '''TUFLOW\results\M01_5m_001.xmdf'''). For more information on loading map outputs, please refer to <u>[[TUFLOW_Viewer_-_Load_Results_-_Map_Outputs | TUFLOW Viewer - Load Results - Map Outputs]].</u> |
||
<li>Click on a scalar dataset 'Depth' under the Result Type in the TUFLOW Viewer 'Map Outputs' list. |
|||
<li>Update the map styling as desired. In this example, the 'Blues' colour ramp has been selected and the temporal bar has been adjusted to show depth results near the peak of the event. <br> |
|||
| ⚫ | |||
<br> |
|||
[[File: QGIS_3D_Animation_Load_Results_01.png]]<br> |
|||
<br> |
|||
</ol> |
|||
==Configure DEM in 3D Map View== |
|||
| ⚫ | |||
Create a new 3D map view and configure the DEM to display as a 3D Mesh. |
|||
<ol> |
|||
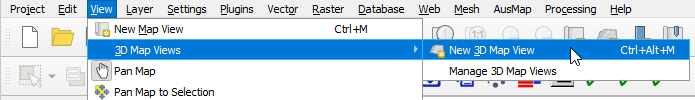
<li> In the top dropdown menu options, go to View > 3D Map Views > New 3D Map View.<br> |
|||
<br> |
|||
[[File: QGIS_3D_Animation_Configure_DEM_01.png]]<br> |
|||
<br> |
|||
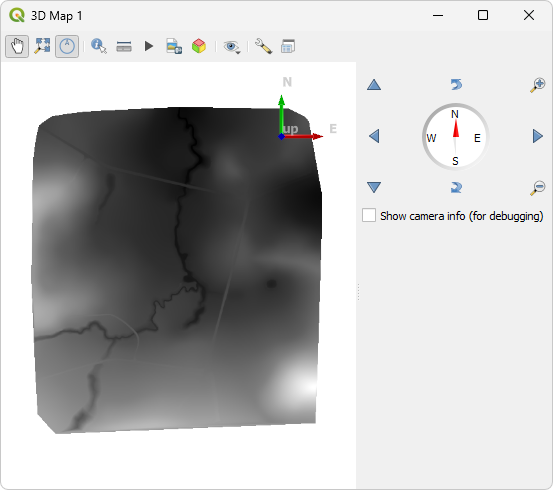
<li> The following 3D Map View window will open: <br> |
|||
<br> |
|||
[[File: QGIS_3D_Animation_Configure_DEM_02.png]]<br> |
|||
<br> |
|||
<li>Configure the DEM to display as a 3D mesh: |
|||
* Select 'Zoom Full' [[File:Zoom full icon.png]] to center the map view on to the DEM. |
|||
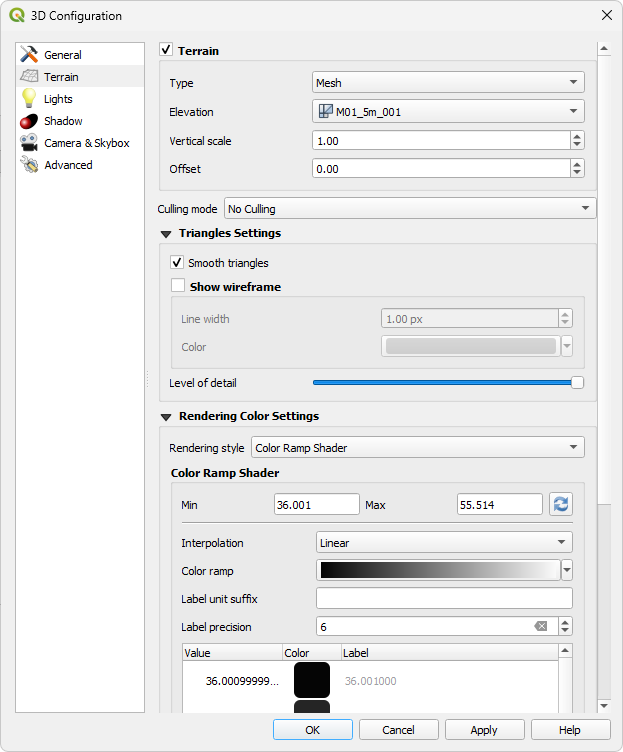
* Select 'Options' [[File:Settings icon.png]] > 'Configure'. A '3D Configuration' window will open. Select the 'Terrain' tab and enable the following settings (leave all other settings as default): |
|||
** Type: Mesh |
|||
** Elevation: M01_5m_001 |
|||
** Tick on 'Smooth triangles' |
|||
** Rendering style: Color Ramp Shader |
|||
** Color ramp: Greys >> Invert Color Ramp <br> |
|||
** Click OK <br> |
|||
<br> |
|||
[[File: QGIS_3D_Animation_Configure_DEM_03.png]]<br> |
|||
<br> |
|||
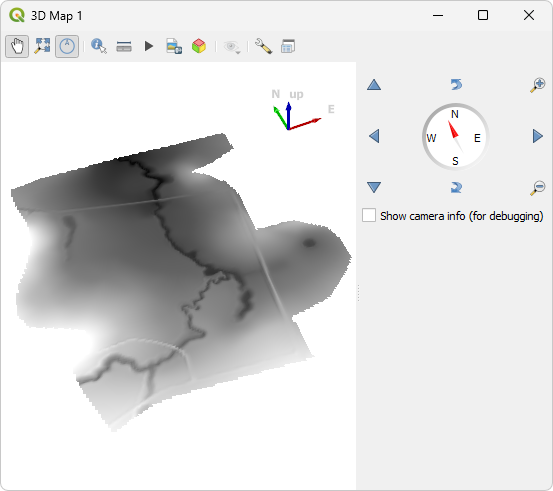
<li>The 3D Map View now displays the 3D surface:<br> |
|||
'''Note:''' For more information on navigating within the 3D map view, please refer to <u>[https://docs.qgis.org/3.34/en/docs/user_manual/map_views/3d_map_view.html#navigation-options QGIS Documentation - 3D Map View, Navigation Options].</u> |
|||
<br> |
|||
<br> |
|||
[[File: qgis_3d_animation_configure_dem_04a.png]]<br> |
|||
<br> |
|||
</ol> |
</ol> |
||
==Load Results in 3D Map View== |
|||
Load the maximum depth results in to the 3D Map View. |
|||
<ol> |
|||
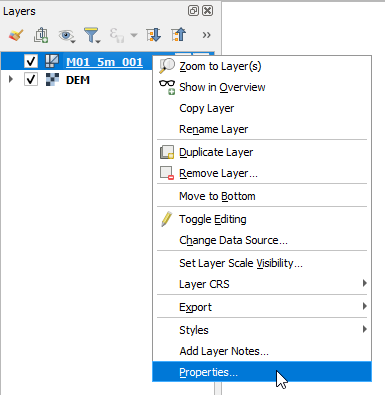
<li>In the QGIS Layers panel, right click the results layer and select 'Properties...'<br> |
|||
<br> |
|||
[[File: QGIS_3D_Animation_Add_Results_01.png]]<br> |
|||
<br> |
|||
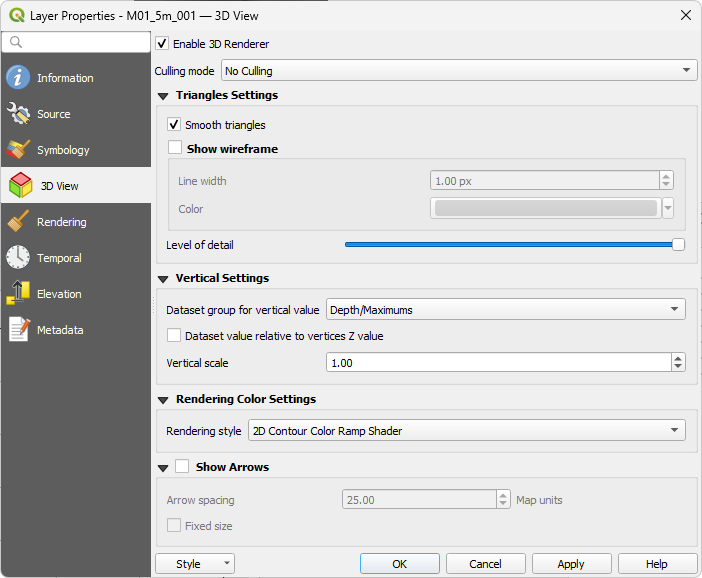
<li>In the 3D View tab, enable the following settings (leave all other settings as default): |
|||
* Tick on 'Enable 3D Renderer' |
|||
* Tick on 'Smooth Triangles' |
|||
* Dataset group for vertical value: Depth/Maximums |
|||
* Rendering style: "2D Contour Color Ramp Shader" |
|||
* Click OK <br> |
|||
<br> |
|||
[[File: QGIS_3D_Animation_Add_Results_02.png]]<br> |
|||
<br> |
|||
<li> Open the 3D Map View to view the 3D depth results and terrain. |
|||
<br> |
|||
[[File:3Dview results.png]]<br> |
|||
<br> |
|||
'''Note:''' The "2D Contour Color Ramp Shader" rendering style option sets the symbology of the results to replicate the symbology in the current 2D map view. For this example, the depth results in the 3D map view reflects the depth map output symbology. |
|||
</ol> |
|||
| ⚫ | |||
A 3D animation is based on a set of keyframes (camera positions at certain times). To create an animation: |
|||
<ol> |
|||
<li>In the 3D Map View, toggle on the 'Animations' tool [[File: QGIS_3D_Animation_animation_button_01.png|20px]]. This opens the following widget:<br> |
|||
<br> |
<br> |
||
[[File: QGIS_3D_Animation_player_widget_01.png]]<br> |
|||
<br> |
|||
<li>Click 'Add Keyframe' [[File: QGIS_3D_Animation_add_keyframe_button_01.png]] and enter a time in seconds. This will add the time to the Keyframe dropdown box:<br> |
|||
<br> |
|||
[[File: QGIS_3D_Animation_keyframe_dropdown_box_01.png]]<br> |
|||
<br> |
|||
<li>Use the navigation tools to move the 3D map to the desired position for the current keyframe time. |
|||
<li>Repeat steps 2 and 3 to add as many keyframes as required. QGIS will generate scenes using the 3D map's positions/rotations at set times, and it will interpolate them in between the keyframes. |
|||
<li>To preview the animation, click 'Play', or use the timeslider. |
|||
</ol> |
|||
For more information on 3D animations, please refer to <u>[https://docs.qgis.org/3.34/en/docs/user_manual/map_views/3d_map_view.html#creating-an-animation QGIS Documentation - Creating an animation]</u>. |
|||
=Additional Resources= |
|||
The Qgis2threejs plugin can also be used to create a 3D map view and animation. For more details, see <u>[https://minorua.github.io/Qgis2threejs/docs/ Qgis2threejs Plugin Document]</u> |
|||
<br> |
<br> |
||
{{Tips Navigation |
{{Tips Navigation |
||
Latest revision as of 10:06, 27 January 2025
Introduction
This page outlines the process for creating a 3D animation using QGIS. QGIS version 3.34.1 has been used for this example.
Required Data
To create a 3D animation in QGIS, the following files are required as a minimum:
- Digital Elevation Model (DEM) or TIN; and
- 2D Model Results.
Note: Additional files may also be used to enhance the animation.
This example uses the DEM and 2D results from Tutorial Module 1. The complete model is available from Tutorial Introduction.
Method
Configure the QGIS Workspace
Configure the QGIS workspace and display the depth (d) datasets. The same process can be followed for other output datasets.
- Load the DEM.tif into the QGIS workspace.
- Open the TUFLOW Viewer from the TUFLOW plugin toolbar:
- Open the 2D model results. Go to 'File' > 'Load Results - Map Outputs' from the TUFLOW Viewer menu options and navigate to the *.xmdf results file (e.g. TUFLOW\results\M01_5m_001.xmdf). For more information on loading map outputs, please refer to TUFLOW Viewer - Load Results - Map Outputs.
- Click on a scalar dataset 'Depth' under the Result Type in the TUFLOW Viewer 'Map Outputs' list.
- Update the map styling as desired. In this example, the 'Blues' colour ramp has been selected and the temporal bar has been adjusted to show depth results near the peak of the event.
Note: For more details on map styling, please refer to TUFLOW Viewer - Map Outputs - Styling Scalar Types.


Configure DEM in 3D Map View
Create a new 3D map view and configure the DEM to display as a 3D Mesh.
- In the top dropdown menu options, go to View > 3D Map Views > New 3D Map View.
- The following 3D Map View window will open:
- Configure the DEM to display as a 3D mesh:
- Select 'Zoom Full'
 to center the map view on to the DEM.
 - Select 'Options'
 > 'Configure'. A '3D Configuration' window will open. Select the 'Terrain' tab and enable the following settings (leave all other settings as default):
- Type: Mesh
- Elevation: M01_5m_001
- Tick on 'Smooth triangles'
- Rendering style: Color Ramp Shader
- Color ramp: Greys >> Invert Color Ramp
- Click OK
- Select 'Zoom Full'
- The 3D Map View now displays the 3D surface:
Note: For more information on navigating within the 3D map view, please refer to QGIS Documentation - 3D Map View, Navigation Options.


Load Results in 3D Map View
Load the maximum depth results in to the 3D Map View.
- In the QGIS Layers panel, right click the results layer and select 'Properties...'
- In the 3D View tab, enable the following settings (leave all other settings as default):
- Tick on 'Enable 3D Renderer'
- Tick on 'Smooth Triangles'
- Dataset group for vertical value: Depth/Maximums
- Rendering style: "2D Contour Color Ramp Shader"
- Click OK
- Open the 3D Map View to view the 3D depth results and terrain.
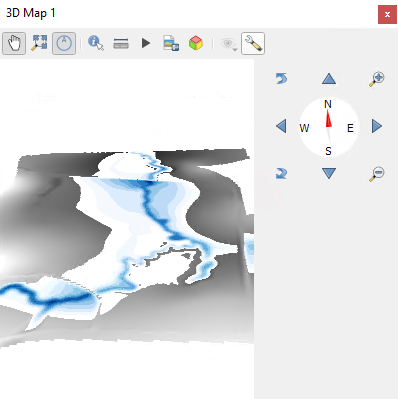
Note: The "2D Contour Color Ramp Shader" rendering style option sets the symbology of the results to replicate the symbology in the current 2D map view. For this example, the depth results in the 3D map view reflects the depth map output symbology.


Create a 3D Animation
A 3D animation is based on a set of keyframes (camera positions at certain times). To create an animation:
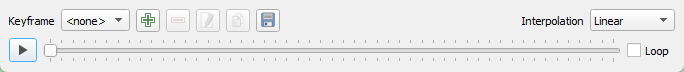
- In the 3D Map View, toggle on the 'Animations' tool
 . This opens the following widget:
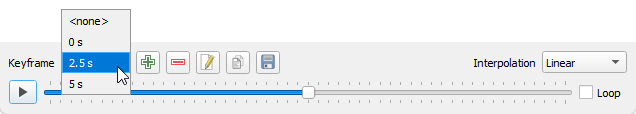
- Click 'Add Keyframe'
 and enter a time in seconds. This will add the time to the Keyframe dropdown box:
- Use the navigation tools to move the 3D map to the desired position for the current keyframe time.
- Repeat steps 2 and 3 to add as many keyframes as required. QGIS will generate scenes using the 3D map's positions/rotations at set times, and it will interpolate them in between the keyframes.
- To preview the animation, click 'Play', or use the timeslider.


For more information on 3D animations, please refer to QGIS Documentation - Creating an animation.
Additional Resources
The Qgis2threejs plugin can also be used to create a 3D map view and animation. For more details, see Qgis2threejs Plugin Document
| Up |
|---|