TUFLOW to GIS: Difference between revisions
Anne.Kolega (talk | contribs) m →General Input Switches: e.g. |
Anne.Kolega (talk | contribs) m →General Input Switches: i.e. |
||
| (2 intermediate revisions by the same user not shown) | |||
| Line 73: | Line 73: | ||
|"-cd<depth>"|| Sets the cutoff depth for use with -mif or -shp output, this is used when processing the water level and depth outputs. The default is 0.01m (or 0.01ft if the results are in feet). |
|"-cd<depth>"|| Sets the cutoff depth for use with -mif or -shp output, this is used when processing the water level and depth outputs. The default is 0.01m (or 0.01ft if the results are in feet). |
||
|- |
|- |
||
|"-prec< u >.< d >"|| Sets the output precision for -asc, -mif and -shp options. For example -prec6.3 would output 6 units (or 5 units if number is negative) ( |
|"-prec< u >.< d >"|| Sets the output precision for -asc, -mif and -shp options. For example -prec6.3 would output 6 units (or 5 units if number is negative) (i.e. from -99,999 to 999,999) with 3 decimal places. |
||
|- |
|- |
||
|"-sec"|| Display and enter times in seconds (default = hours). |
|"-sec"|| Display and enter times in seconds (default = hours). |
||
| Line 84: | Line 84: | ||
|- |
|- |
||
|"-ttf<TT_Factor>" || Scales the thickness of arrow tails (default = 0). It will produce arrows suitable for ArcGIS if TT_factor is non-zero. <br> |
|"-ttf<TT_Factor>" || Scales the thickness of arrow tails (default = 0). It will produce arrows suitable for ArcGIS if TT_factor is non-zero. <br> |
||
+ve value( |
+ve value (e.g. -ttf.01): Thickness is TT_Factor times the arrow size.<br> |
||
-ve value( |
-ve value (e.g. -ttf-.01): Thickness is TT_Factor times the cell size. |
||
|- |
|- |
||
|"-vmax<vmax>"|| The max vector magnitude for scaling vector arrow points.Default is no scaling except for _V.dat files which it is 10. |
|"-vmax<vmax>"|| The max vector magnitude for scaling vector arrow points.Default is no scaling except for _V.dat files which it is 10. |
||
| Line 233: | Line 233: | ||
*<tt>TUFLOW_to_GIS.exe -cp "CP_File.mif" -typeH -max M03_5m_003.xmdf</tt><br> |
*<tt>TUFLOW_to_GIS.exe -cp "CP_File.mif" -typeH -max M03_5m_003.xmdf</tt><br> |
||
The CP file inputs, flood model result and difference in peak flood level relative to the recorded level is output to a GIS file ( |
The CP file inputs, flood model result and difference in peak flood level relative to the recorded level is output to a GIS file (e.g. '<CP_filename>_<TUFLOW_model_filename>.shp') <br> |
||
<br> |
<br> |
||
[[File: T2G_Longsection_001.PNG|300px]]<br> |
[[File: T2G_Longsection_001.PNG|300px]]<br> |
||
<br> |
<br> |
||
<li>Compute longitudinal profiles of maximum flood level model results. Associate recorded high water marks (in shp or mif format) with the profile if the point location is within a defined radius of the longitudinal profile line.<br> |
<li>Compute longitudinal profiles of maximum flood level model results. Associate recorded high water marks (in shp or mif format) with the profile if the point location is within a defined radius of the longitudinal profile line.<br> |
||
Latest revision as of 11:54, 2 April 2026
Introduction
The TUFLOW_to_GIS.exe is a utility available on the TUFLOW website (Download TUFLOW utilities).
The utility can be used to convert TUFLOW outputs (.xmdf and .dat) into formats that can be imported into GIS packages such as MapInfo, ArcGIS, and QGIS.
Note That as per the 2013 version of TUFLOW, TUFLOW can now write directly to the gridded formats (.asc and .flt). This avoids the need for a separate conversion step. This is outlined in the release notes.
The output frequency and data types can now be specified independently for each data output format. An example is given below:
Map Output Data Format == XMDF ASC
XMDF Map Output Data Types == h v d dt
XMDF Map Output Interval == 300
ASC Map Output Data Types == h v d Z0
ASC Map Output Interval == 0
In the example above, both .xmdf and .asc are written directly by TUFLOW. For the .xmdf output the water levels, velocity, depth and mass balance output are written every 300 seconds (5 minutes). For the .asc format the water levels, velocities, depths and hazard (velocity depth product) are written. These are written only for the maximum (ASC Map Output Interval == 0).
The TUFLOW to GIS utility can output to grid format and also MapInfo and Shapefile format. For the MapInfo and Shapefile format this can be either as points, or as arrows.
Running TUFLOW_to_GIS
Simply double clicking on the TUFLOW_to_GIS executable will bring up a console window that that gives you some instructions on running the utility.
The most common way to run the utility is from a batch file. This allows the user to process multiple outputs at once. A batch file is simply a plain text file containing one or more lines that execute a utility as per the example sections below.
For more common tasks a right click function can be setup in Windows to perform a particular conversion. FileMenuTools can be used to set custom right click functionality, the method is described in the Windows Right Click Functionality. The Program input should refer to the location of the TUFLOW_to_GIS executable and the Arguments input should contain the desired option and then %FILENAMES%. For example -b -asc -typeAll -max %FILENAMES% could be used to convert all of the "Maximums" data into gridded .asc format.
Output Options
Gridded Data
Gridded (raster) data is outputted in the ESRI ASCII grid format. This is plain text format and is very widely recognised and used by a variety of GIS software including ArcGIS (requires Spatial Analyst), QGIS, and MapInfo (requires Vertical Mapper or Encom Discover). This is specified with the flag -asc.
The TUFLOW to GIS utility uses the same approach as TUFLOW for interpolating a raster. That is, each cell is split into 4 triangles with a common vertex at the cell centre. An ASCII grid output directly from TUFLOW will use the calculated value at the cell centre (ZC). For an ASCII grid output using the TUFLOW to GIS utility, the centre used is the average of the corners. For this reason, the grids will not be exactly the same.
Point and Vector Data
Vector outputs (e.g. velocity or flow) can be written as either points or arrows. Scalar outputs (e.g. depth or level) can be written as points. These can currently be written out in either MapInfo format (.mif) or shapefiles (.shp). The -mif flag is used to output in MapInfo format and -shp to output in shapefile format. Only one type (-mif or -shp) can be processed at a time, to output in both formats, use two entries in a batch file.
Switches (Input Flags)
General Input Switches
A list of the input switches is provided below:
| Switch | Description |
|---|---|
| "-b" | Run the utility in batch mode, this suppresses the prompt to press enter at the end of processing. Used in .bat files where two or more files are to be processed. |
| "-asc" | The output file will be in ESRI ASCII Grid format, a text format recognised by most 3D grid modelling software (including Vertical Mapper and QGIS) |
| "-mif" | The output format will be the MapInfo Interchange format (.mif/.mid) recognised by most GIS software |
| "-shp" | The output format will be the shapefile format. This can be opened directly in QGIS and ArcMap (and most GIS software) |
| "-vector" or "-arrows" | The output will contain arrows as polygons to display vector data (e.g. velocities and unit flows) in GIS. Must be used with the -mif or -shp option. |
| "-slant<slant factor>" | Changes the arrow head slant in the vector GIS output above. The default is -slant12 which gives 30 degree arrow head according to the equation ((180/slant)*2) |
| "-t<output time>" | Converts the data at the specified timestep, for example -t2 to convert output time 2 hours. If this switch is omitted the utility will display a list of available times and prompt for an input. Use -t99999 or -max to convert the maximums. |
| "-tAll" | Converts all output times from the .xmdf or .dat file. |
| "-max" or "-t99999" | The maximums will be converted. The maximums must have been written to be able to convert using the -max or -t99999 switch. See the .tcf file command (Store Maximums and Minimums == ON MAXIMUMS ONLY). |
| "-sf<scale factor>" | Scale factor to scale the size of the arrows. The default is sf = 1, which means the cell size of the first 2D domain in the .tcf file is equivalent in length to an arrow of 1m/s for velocity datasets or 1m3/s for unit flow datasets. |
| "-2dm <.2dm file>" | To explicitly specify a .2dm file. By default TUFLOW_to_GIS assumes the .2dm file has the same name as the .xmdf file. Must be a space between -2dm and “<2dm_file>”. |
| "-grid<dist>" | The output will be on a regular north-south aligned grid of spacing <dist> metres. If no <dist> is specified the user is prompted to enter a distance (e.g. "-grid"). If no grid input is used with a -mif or -shp conversion the data is converted at the cell corners. For a "-asc" output if no grid input is specified the default is 1/2 of the 2D cell size. For -asc output it sets the raster cell size of the 3D ESRI ASCII grid. |
| "-cd<depth>" | Sets the cutoff depth for use with -mif or -shp output, this is used when processing the water level and depth outputs. The default is 0.01m (or 0.01ft if the results are in feet). |
| "-prec< u >.< d >" | Sets the output precision for -asc, -mif and -shp options. For example -prec6.3 would output 6 units (or 5 units if number is negative) (i.e. from -99,999 to 999,999) with 3 decimal places. |
| "-sec" | Display and enter times in seconds (default = hours). |
| "-out<output file name, without file extension>" | To specify the name of the output files. Extension added based on output format. Note: not applicable when converting multiple outputs (e.g. multiple times). |
| "-sgs" | Suppresses the grid size from the output file name. For example Run_h_g005_max.asc will become Run_h_max.asc |
| "-rmp<mesh_part>" | Removes a mesh part from the output. <mesh_part> must be the same name as appears in the .2dm file. The .tcf command Meshparts == ON must have been specified. |
| "-ttf<TT_Factor>" | Scales the thickness of arrow tails (default = 0). It will produce arrows suitable for ArcGIS if TT_factor is non-zero. +ve value (e.g. -ttf.01): Thickness is TT_Factor times the arrow size. |
| "-vmax<vmax>" | The max vector magnitude for scaling vector arrow points.Default is no scaling except for _V.dat files which it is 10. |
| " -wld " | It is used for creating a .wld file from a .tab file. The .tab file must be one created using the Save Window As...option in MapInfo to geo-reference a screen image. |
| "-pts<pt types>" | Outputs only the specified out locations. Note: only valid with -mif or -shp output. Default is All. Any combination of the following: C - 2D cell centres |
| "-region" | Outputs a region object, for each 2D cell the output value is the cell centre output. Note: only valid with -mif or -shp output. |
XMDF Switches
When working with the .xmdf outputs from TUFLOW, there are some additional input switches are available. This is because the .xmdf file uses a folder structure and multiple output parameters are stored in the same .xmdf file. When converting you can control which dataset is converted using the switches below. These switches are not valid for .dat files as these contain a single parameter for each file. E.g. the _d.dat contains only depth information.
In the xmdf file, the data is stored in the following structure:
Simulation ID/Folder/Dataset. Some examples for simulation "M01_5m_001" are:
M01_5m_001/Maximums/ZAEM1
M01_5m_001/Temporal/Depth
The xmdf specific switches are outlined in the table below:
| Switch | Description |
|---|---|
| "-type<output type>" | Converts the specified output type in an xmdf file. Output types should be specified as per the output type in the .tcf e.g. h (water level), v (velocity), q (unit flow) or d (depth). Output types other than h, v, q and d are not predefined with the -type switch and should be called with -v and/or -s switch. |
| "-typeAll" | Converts all available output types in an xmdf file. |
| "-s<output id(integer)>" | Converts the specified scalar dataset in an xmdf file. For example, -s1 will convert the first scalar dataset. A summary of the available datasets is listed within the console window when TUFLOW_to_GIS is preprocessing results. Check XMDF Dataset Example. To keep the console window open write "pause" at the end of the processing batch file and remove -b switch. |
| "-v<output id(integer)>" | Converts the specified vector dataset in an xmdf file. For example, -v1 will convert the first vector dataset. A summary of the available datasets is listed within the console window when TUFLOW_to_GIS is preprocessing results. Check XMDF Dataset Example. To keep the console window open write "pause" at the end of the processing batch file and remove -b switch. |
| "-Folder<Folder Name>" | Converts all datasets within a particular xmdf file. For example, -Folder"Maximums" will convert all datasets in the \Maximums\ folder. |
| "-path<path name>" | Converts a dataset based on the path in the .xmdf file. For example, -path"Maximums/ZAEM1" would convert the dataset Maximum ZAEM1 dataset. This can be a full path in the .xmdf file or a partial match. E.g.: -path"Maximums/ZAEM1" M01_5m_001.xmdf |
XMDF Dataset Example
For example, to convert the maximum Z1 output from “M01_5m_002_mult.xmdf” the console window shows us that this is the fifth scalar dataset and the below command would be used:
TUFLOW_to_GIS_w64.exe -asc -s5 -max M01_5m_002_mult.xmdf
Another way to extract the same dataset using the -path switch is:
TUFLOW_to_GIS_w64.exe -asc -path"Maximums/Z1" M01_5m_002_mult.xmdf

Calibration Point and Longitudinal Profile Switches
| Switch | Description |
|---|---|
| "-cp<cp_file>" | For appending the value from a .xmdf or .dat file to a .shp or .mif file. The cp_file contains points representing locations where results are extracted from TUFLOW. The file format includes two attributes. The first attribute is a numeric field containing the recorded value. The second field is a char(100) text field containing the cp name. The cp_file is also used to find calibration points near any longitudinal profile.
'Note: requires a space after -cp. Quotes should be used if spaces existing within the filename.' |
| "-cpsd<sd>" | The search distance for finding calibration points near a longitudinal profile. |
| "-lpmd<md>" | The distance between LP chainage markers along a longitudinal profile. |
| "-lp<lp_file>" | For longitudinal profile output. The lp_file contains polyline(s) representing the lp alignments(s). The first and only attribute within the file is a char(100) containing the lp name. One <lp_name>.csv file for each polyline is produced.
'Note: requires a space after -lp. Quotes should be used if spaces existing within the filename.' |
| "-fso" | Free Surface Only, sets 1D water levels in pipes to the obvert/soffit level if running full |
Examples
Converting to 3D grids
Probably the most common use of the TUFLOW_to_GIS utility is to convert the maximum results to a 3D surface. A number of examples are given below:
- Convert water level maximums to a 3D grid:
- TUFLOW_to_GIS.exe -b -asc -max -typeH M01_5m_001.xmdf
- Description: Using batch mode (-b), convert to a 3D grid (-asc), converting the maximums (-max) for the water level results (-typeH).
- TUFLOW_to_GIS.exe -b -asc -max -typeH M01_5m_001.xmdf
- Convert to a 3D grid at a specific time:
- TUFLOW_to_GIS.exe -b -asc -t3 -typeH M01_5m_001.xmdf
- Description: As per example 1, except conversion at time 3 hours (-t3) instead of the maximums.
- TUFLOW_to_GIS.exe -b -asc -t3 -typeH M01_5m_001.xmdf
- Convert to a 3D grid of specified grid cell size:
- TUFLOW_to_GIS.exe -b -asc -max -grid1 -typeH M01_5m_001.xmdf
- Description: As per example 1, except the raster cell size is specified at 1m instead of being half the 2D cell size.
- TUFLOW_to_GIS.exe -b -asc -max -grid1 -typeH M01_5m_001.xmdf
- Convert velocity maximums to a 3D grid:
- TUFLOW_to_GIS.exe -b -asc -max -typeV M01_5m_001.xmdf
- Description: As per example 1, except the velocity results (-typeV) are processed instead of water level (-typeH).
- TUFLOW_to_GIS.exe -b -asc -max -typeV M01_5m_001.xmdf
- Convert Z1 hazard maximums to a 3D grid:
- TUFLOW_to_GIS.exe -b -asc -max -s5 M01_5m_001.xmdf
- Description: As per example 1, except the Z1 hazard (-s5 based on the XMDF Dataset Example) are processed instead of water level (-typeH).
- TUFLOW_to_GIS.exe -b -asc -max -s5 M01_5m_001.xmdf
Converting to Points
To output to a points file specify either a shapefiles output with the "-shp" switch or MapInfo output with the "-mif" output. To output at cell corners only:
- Convert maximums to a shapefile points file at cell corners:
- TUFLOW_to_GIS.exe -b -shp -max -typeH M01_5m_001.xmdf
- Description: Using batch mode (-b), convert to a shapefile format (-shp), converting the maximums (-max) for the water level results (-typeH).
- TUFLOW_to_GIS.exe -b -shp -max -typeH M01_5m_001.xmdf
- Convert maximums to a shapefile points file on a regular grid:
- TUFLOW_to_GIS.exe -b -shp -max -grid2 -typeH M01_5m_001.xmdf
- Description: Using batch mode (-b), convert to a shapefile format (-shp), converting the maximums (-max), on a regular 2m grid (-grid2) for the water level results (-typeH).
- TUFLOW_to_GIS.exe -b -shp -max -grid2 -typeH M01_5m_001.xmdf
- Convert velocity at time 2 hours to shapefile points file:
- TUFLOW_to_GIS.exe -b -shp -t2 -typeV M01_5m_001.xmdf
- Description: Using batch mode (-b), convert to a shapefile format (-shp), at time of 2 hours (-t2), converting the velocity output (-typeV).
- TUFLOW_to_GIS.exe -b -shp -t2 -typeV M01_5m_001.xmdf
- Convert the model topography to shapefile points file format:
- TUFLOW_to_GIS.exe -b -shp M01_5m_001.2dm
- Description: Using batch mode (-b), convert to a shapefile format (-shp), converting the model topography.
- TUFLOW_to_GIS.exe -b -shp M01_5m_001.2dm
Converting to Arrows
To output to vectors file specify either a shapefiles "-shp" or MapInfo "-mif" output type and the "-vector" option. This will create a vector dataset, with the vectors stored as polygon objects.
The size of the vectors can be controlled with the scale factor ("-sf") switch.
NOTE: If using input .dat file the dataset type must be a vector dataset, such as velocity or unit flow.
- Convert output time 2 to a shapefile at cell corners:
- TUFLOW_to_GIS.exe -b -shp -vector -t2 -typeV M01_5m_001.xmdf
- Description: Using batch mode (-b), convert to a shapefile format (-shp), using vector outputs (-vector), and converting at time 2 hours (-t2) for the velocity results (-typeV).
- TUFLOW_to_GIS.exe -b -shp -vector -t2 -typeV M01_5m_001.xmdf
- Convert output time 2 to a shapefile at cell corners:
- TUFLOW_to_GIS.exe -b -shp -vector -t2 -sf0.5 -typeV M01_5m_001.xmdf
- Description: As above with a scale factor of 0.5, so that the arrows will be half the length.
- TUFLOW_to_GIS.exe -b -shp -vector -t2 -sf0.5 -typeV M01_5m_001.xmdf
- Convert output time 2 to a shapefile on a regular grid of 2m spacing for unit flow:
- TUFLOW_to_GIS.exe -b -shp -vector -t2 -sf0.5 -grid2 -typeq M01_5m_001.xmdf
- Description: As above on a regular 2 metre grid (-grid2) for the unit flow results (-typeq).
Note: When using processed maxmax xmdf from RES_to_RES utility the -typeV switch needs to be replaced with -v1 switch. -v1 switch calls for the first vector dataset.
- TUFLOW_to_GIS.exe -b -shp -vector -t2 -sf0.5 -grid2 -typeq M01_5m_001.xmdf
Calibration Points and Longitudinal Profiles
These command options are used to extract longitudinal profile information from model results. Input format requirements for the CP and LP files are provided in the calibration point and longitudinal profile commands table within the 'Input Flags' section of this page.
- Compute difference between recorded high water mark (in shp or mif format) and modelled maximum flood level:
- TUFLOW_to_GIS.exe -cp "CP_File.shp" -typeH -max M03_5m_003.xmdf
- TUFLOW_to_GIS.exe -cp "CP_File.mif" -typeH -max M03_5m_003.xmdf
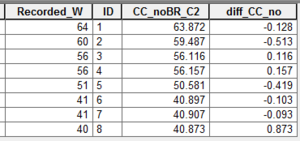
- TUFLOW_to_GIS.exe -cp "CP_File.shp" -typeH -max M03_5m_003.xmdf
- Compute longitudinal profiles of maximum flood level model results. Associate recorded high water marks (in shp or mif format) with the profile if the point location is within a defined radius of the longitudinal profile line.
- TUFLOW_to_GIS.exe -cp "CP_File.shp" -lp "LP_File.shp" -cpsd100 -lpmd2500 -typeH -max M03_5m_003.xmdf
- TUFLOW_to_GIS.exe -cp "CP_File.mif" -lp "LP_File.mif" -cpsd100 -lpmd2500 -typeH -max M03_5m_003.xmdf
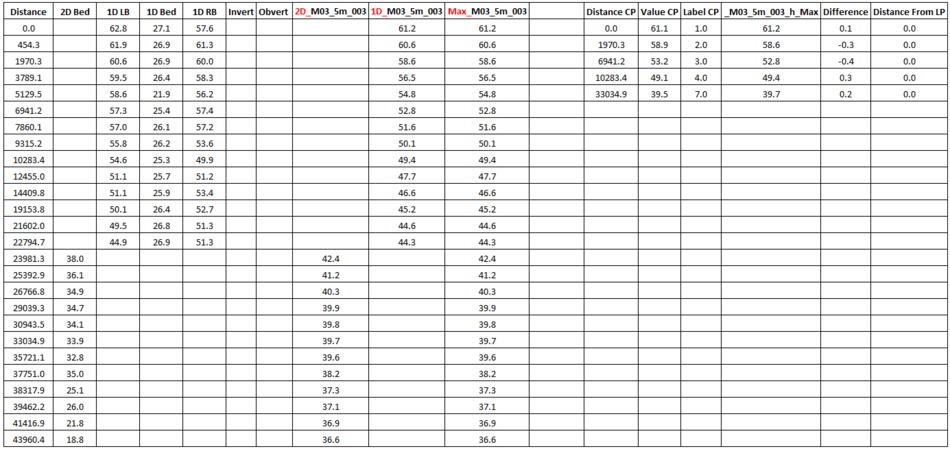
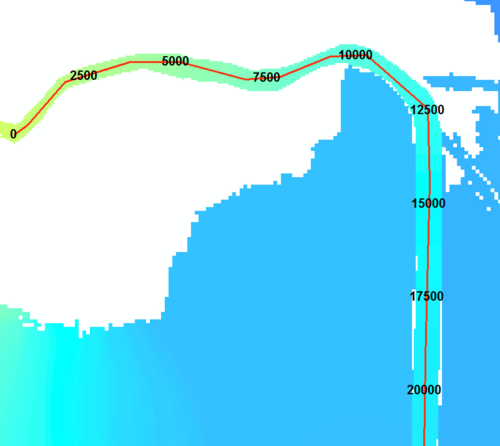
- TUFLOW_to_GIS.exe -cp "CP_File.shp" -lp "LP_File.shp" -cpsd100 -lpmd2500 -typeH -max M03_5m_003.xmdf


| Up |
|---|