TUFLOW Viewer - Batch Exporting Maps: Difference between revisions
Jump to navigation
Jump to search
Content deleted Content added
Ellis Symons (talk | contribs) No edit summary |
Ellis Symons (talk | contribs) No edit summary |
||
| Line 21: | Line 21: | ||
[[File: Maps_LayoutTab_PageProperties.PNG | 450px]] |
[[File: Maps_LayoutTab_PageProperties.PNG | 450px]] |
||
<li> '''Legend, Scale Bar, North Arrow''' - the next three items will add common map items. Users can edit the properties of the item and add things like a background and border.<br> |
<li> '''Legend, Scale Bar, North Arrow''' - the next three items will add common map items. Users can edit the properties of the item and add things like a background and border.<br> |
||
[[File:Animation_Layout_Item_Settings.PNG | |
[[File:Animation_Layout_Item_Settings.PNG | 350px]] |
||
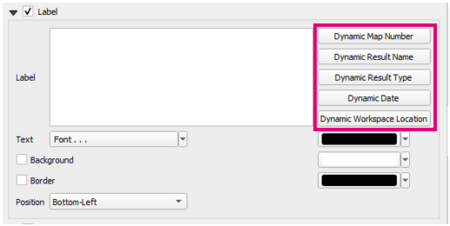
<li> '''Label''' - Users can also add a custom label with dynamic text. This is useful if the user would like to add information to the map such as the result name, result type, or date the map was produced. This can be done by using the buttons on the right-hand side of the label properties. |
<li> '''Label''' - Users can also add a custom label with dynamic text. This is useful if the user would like to add information to the map such as the result name, result type, or date the map was produced. This can be done by using the buttons on the right-hand side of the label properties. User's can also add their own text to the label, however this will be static. |
||
* '''Dynamic Map Number''' - will add a map number to the label based on the order that the maps are exported |
* '''Dynamic Map Number''' - will add a map number to the label based on the order that the maps are exported |
||
* '''Dynamic Result Name''' - will add the result name to the label (e.g. M03_5m_001) |
* '''Dynamic Result Name''' - will add the result name to the label (e.g. M03_5m_001) |
||
| Line 29: | Line 29: | ||
* '''Dynamic Workspace Location''' - will add the workspace path to the label |
* '''Dynamic Workspace Location''' - will add the workspace path to the label |
||
[[File: Maps_LayoutTab_Label.PNG | 450px]] |
[[File: Maps_LayoutTab_Label.PNG | 450px]] |
||
<li> '''Plots''' - These are dynamic plot objects that will be added to the maps. To add a plot, the plot must already be available in one of the TUFLOW Viewer plotting windows<br> |
|||
[[File: Animation_Layout_Plot_Item.PNG | 450px]] |
|||
<ol> |
|||
<li> Use the add button [[File: Animation_add_button.PNG | 20px]] to add a plot |
|||
<li> Select the source of the plot lines that will be added (i.e. time series, cross section etc.) |
|||
<li> Select the plotting lines to add to the plot. Users can add more than one line or split the lines onto multiple plots. If the line is on secondary axis, this will be retained unless the need for the secondary axis becomes redundant (e.g. it's the only line on the plot) |
|||
<li> Set the position. This is only the starting position and can be moved later in the print layout |
|||
<li> Set the plot properties. When the user clicks this button, TUFLOW Viewer will calculate the min/max for the plot axes. For lines on the cross-section and vertical profile plots, this can take some time as TUFLOW Viewer will need to step through every timestep to find the min/max values.<br> |
|||
[[File: Animation_Plot_Properties_Dialog.PNG | 450px]] |
|||
<ol> |
|||
<li> '''Plot Title''' - can be useful to indicate where the plot was extracted from by aligning the title with labels in the print layout |
|||
<li> '''Axis labels''' - will be populated with default values |
|||
<li> '''Axis Limits''' - will be populated with calculated extents and the extents can be recalculated using '''Auto Calc''' |
|||
<li> '''Legend''' - legend can be added or removed. Legend location options are not as extensive as the TUFLOW Viewer itself, most notably 'Auto' is not available. |
|||
<li> '''Grid lines''' - can be toggled on/off |
|||
<li> '''Figure Size''' - will default to 100 x 100. This can be changed in the print layout and the plot will be re-rendered prior to the animation to fit the desired size. |
|||
</ol> |
|||
<li> If the plot point/line was drawn by the user (not a vector layer), a graphic object will be added to the appropriate location to indicate the extraction location. This can be toggled off by unchecking this box. |
|||
<li> Label for the graphic object - this can be changed later in the print layout |
|||
<li> Label position relative to the graphic object |
|||
<li> Label properties:<br> |
|||
[[File: Animation_Label_Properties_Dialog.PNG | 450px]] |
|||
<ol> |
|||
<li> Label font settings |
|||
<li> Background and box settings |
|||
</ol> |
|||
</ol> |
|||
</ol> |
</ol> |
||
Revision as of 18:34, 28 April 2021
Tool Description
TUFLOW Viewer offers the ability to batch export maps using mesh layers (does not support other result types yet e.g. time series, particles - it may be possible to use work arounds to get these types to work). This tool does not seek to replace other similar tools that may be inherently built in to QGIS, however does offer the ability to:
- automatically add plots from the mesh layer to the maps
- automatically load mesh results, plot, and export maps
It also offers convenience functionality for adding items such as a legend, images, scales etc, however these can also be added manually in the print layout.
The following steps through the process of batch exporting maps:
- Open the batch export map tool via Export >> Export Maps
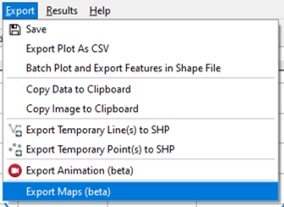
- On the layout tab, the user has the option to use a Default Layout or a Custom Layout. A cusom layout uses a Print Layout Template (.qpt) as an input. The recommended workflow is to:
- Use the Default Layout as a starting point
- Customise the layout using the print layout in QGIS
- Export the print layout as a template (.qpt)
- Use Custom Layout using the template file
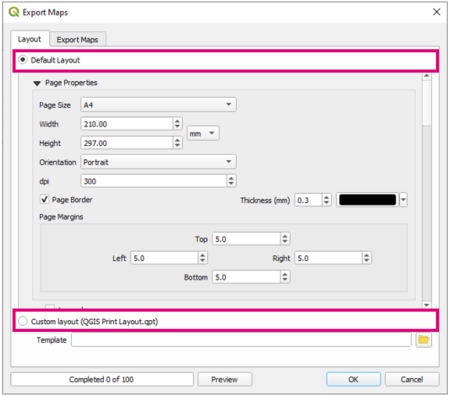
- Assuming the above workflow, the Default Layout lets the user specify some items to add to the layout.
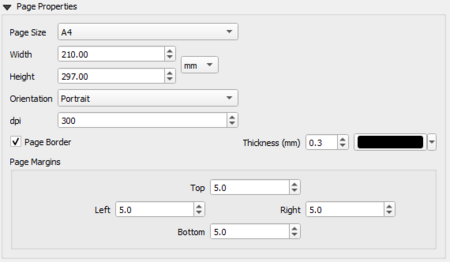
- Page Properties - defines the page size and the orientation of the exported maps. A page border is added by default, however can be turned off or edited in this section.
- Legend, Scale Bar, North Arrow - the next three items will add common map items. Users can edit the properties of the item and add things like a background and border.
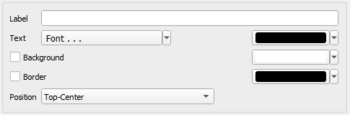
- Label - Users can also add a custom label with dynamic text. This is useful if the user would like to add information to the map such as the result name, result type, or date the map was produced. This can be done by using the buttons on the right-hand side of the label properties. User's can also add their own text to the label, however this will be static.
- Dynamic Map Number - will add a map number to the label based on the order that the maps are exported
- Dynamic Result Name - will add the result name to the label (e.g. M03_5m_001)
- Dynamic Result Type - will add the result type to the label (e.g. Depth - Max)
- Dynamic Date - will add the date the map was exported
- Dynamic Workspace Location - will add the workspace path to the label
- Plots - These are dynamic plot objects that will be added to the maps. To add a plot, the plot must already be available in one of the TUFLOW Viewer plotting windows
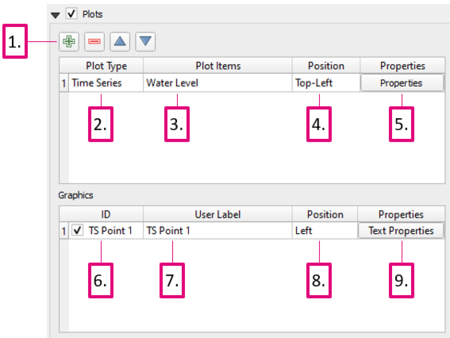
- Use the add button
 to add a plot
- Select the source of the plot lines that will be added (i.e. time series, cross section etc.)
- Select the plotting lines to add to the plot. Users can add more than one line or split the lines onto multiple plots. If the line is on secondary axis, this will be retained unless the need for the secondary axis becomes redundant (e.g. it's the only line on the plot)
- Set the position. This is only the starting position and can be moved later in the print layout
- Set the plot properties. When the user clicks this button, TUFLOW Viewer will calculate the min/max for the plot axes. For lines on the cross-section and vertical profile plots, this can take some time as TUFLOW Viewer will need to step through every timestep to find the min/max values.
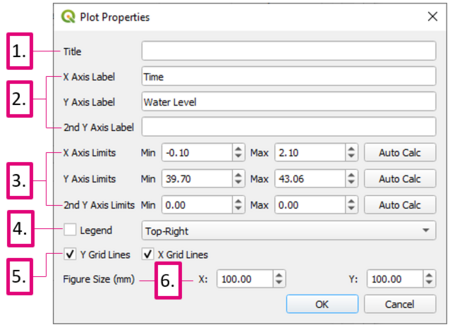
- Plot Title - can be useful to indicate where the plot was extracted from by aligning the title with labels in the print layout
- Axis labels - will be populated with default values
- Axis Limits - will be populated with calculated extents and the extents can be recalculated using Auto Calc
- Legend - legend can be added or removed. Legend location options are not as extensive as the TUFLOW Viewer itself, most notably 'Auto' is not available.
- Grid lines - can be toggled on/off
- Figure Size - will default to 100 x 100. This can be changed in the print layout and the plot will be re-rendered prior to the animation to fit the desired size.
- If the plot point/line was drawn by the user (not a vector layer), a graphic object will be added to the appropriate location to indicate the extraction location. This can be toggled off by unchecking this box.
- Label for the graphic object - this can be changed later in the print layout
- Label position relative to the graphic object
- Label properties:
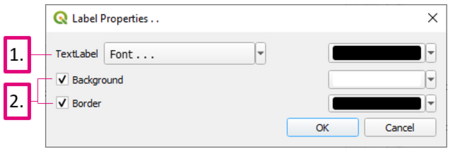
- Label font settings
- Background and box settings
- Use the add button


Examples
The above steps serve as an example of how to batch export maps.