QGIS TUFLOW Apply Stability Styling: Difference between revisions
Ellis Symons (talk | contribs) No edit summary |
Ellis Symons (talk | contribs) No edit summary |
||
| Line 14: | Line 14: | ||
* <b>[[#_TS_P_Output | _TS_P]]</b> |
* <b>[[#_TS_P_Output | _TS_P]]</b> |
||
===_TS_P Output=== |
|||
The _TS_P.shp (_TS.mif) is a 1D timeseries output for Q, V, and H, and includes the following information: |
The _TS_P.shp (_TS.mif) is a 1D timeseries output for Q, V, and H, and includes the following information: |
||
* Maximum value (from every timestep) and the time of maximum |
* Maximum value (from every timestep) and the time of maximum |
||
| Line 20: | Line 20: | ||
* Time series information - this can be slightly different from the results exported to the 'plot' folder as it will reduce the number of outputs to ensure it conforms with GIS attribute limits |
* Time series information - this can be slightly different from the results exported to the 'plot' folder as it will reduce the number of outputs to ensure it conforms with GIS attribute limits |
||
====Rules==== |
|||
The rules to categorise 'Likely Unstable' and 'Possibly Unstable' are very similar and the main difference is that they use different sensitivities. The parameters determining how sensitive each is can be modified by the user. The basic rules are as follows, a more detailed description and how to change the sensitivity can be found further below: |
The rules to categorise 'Likely Unstable' and 'Possibly Unstable' are very similar and the main difference is that they use different sensitivities. The parameters determining how sensitive each is can be modified by the user. The basic rules are as follows, a more detailed description and how to change the sensitivity can be found further below: |
||
* '''Rule 1:''' Flag as unstable if the minimum value is less than zero ''(only applied to "Possibly Unstable")''<br> |
* '''Rule 1:''' Flag as unstable if the minimum value is less than zero ''(only applied to "Possibly Unstable")''<br> |
||
Revision as of 01:15, 28 May 2022
This tool styles the selected layer using a 'traffic light' method to indicate where instabilities could be occurring. This tool currently only supports the _TS.mif (_TS_P.shp) 1D output, however it is intended to expand the scope of this tool in future releases to other inputs and outputs to help with model checking.
Introduced in version 3.3.1
Running the Tool
The tool can be run by clicking the dropdown arrow next to the 'Apply TUFLOW Style to Current Layer' on the toolbar:

Description
The tool uses a 'traffic light' system to indicate where results may be unstable:

The following layers are currently applicable in the tool (the rules are described in the sections below):
_TS_P Output
The _TS_P.shp (_TS.mif) is a 1D timeseries output for Q, V, and H, and includes the following information:
- Maximum value (from every timestep) and the time of maximum
- Minimum value (from every timestep) and the time of minimum
- Time series information - this can be slightly different from the results exported to the 'plot' folder as it will reduce the number of outputs to ensure it conforms with GIS attribute limits
Rules
The rules to categorise 'Likely Unstable' and 'Possibly Unstable' are very similar and the main difference is that they use different sensitivities. The parameters determining how sensitive each is can be modified by the user. The basic rules are as follows, a more detailed description and how to change the sensitivity can be found further below:
- Rule 1: Flag as unstable if the minimum value is less than zero (only applied to "Possibly Unstable")

- Rule 2: Flag as unstable if the minimum and maximum values occur within a certain timeframe of each other

- Rule 3: Flag as unstable if the maximum value falls outside of the time series values by a certain amount

- Rule 4: Flag as unstable if the minimum value falls outside of the time series values by a certain amount

- Rule 5: Flag as unstable if a number time series 'bounces' with a magnitude greater than a given value exceed a given count
Detailed Description
The following detailed rule description refer to the following variables (which can be changed by the user):
FORWARD_LOOK_COUNT
PERC_DIFF_BETWEEN_MAX_AND_TS
UNSTABLE_COUNT_LIMIT
UNSTABLE_PERC_LIMIT
- Detailed Description Rule 1: Flag as unstable if the minimum value is less than zero (only applied to "Possibly Unstable")
- Detailed Description Rule 2: Flag as unstable if the minimum and maximum values occur within FORWARD_LOOK_COUNT number of timesteps. This will not be flagged if the minimum value occurs at the first timestep.
- Detailed Description Rule 3: The following rule uses a TOLERANCE value defined as
TOLERANCE = PERC_DIFF_BETWEEN_MAX_AND_TS multiplied by the time series range (time series max - time series min).
- Flag as unstable if the max value is outside of the time series by the TOLERANCE value (outside means either not close to any of the data points or an interpolated value if the time of max falls inbetween data points)
- Detailed Description Rule 4: Same as rule 3 however with the minimum value rather than the maximum value
- Detailed Description Rule 5: The following rule uses a TOLERANCE value defined as
TOLERANCE = UNSTABLE_PERC_LIMIT multiplied by the time series range (time series max - time series min).
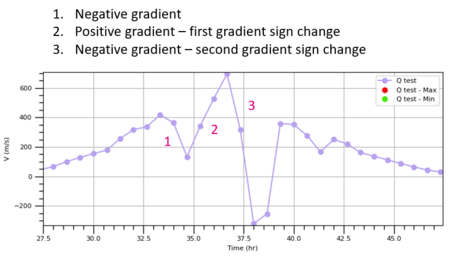
- This rule also defines a bounce as where there are consecutive gradient sign changes
- e.g.
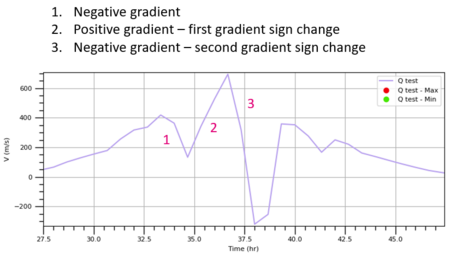
- The gradient sign change is considered 'consecutive' if it occurs within FORWARD_LOOK_COUNT timesteps
- The magnitude of a bounce is defined as:
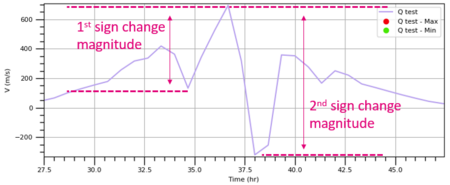
- Flag as unstable if the number of bounces with a magnitude greater than TOLERANCE exceeds UNSTABLE_COUNT_LIMIT.


How to Modfiy the Settings
The settings can be modified by opening the following Python file in a text editor and changing the constants at the top of the file. The values shown in the image below are currently the default values.
%appdata%\QGIS\QGIS3\profiles\default\python\plugins\tuflow\alg\custom_styling_functions.py

| Up |
|---|