Tutorial M06 001 Results QGIS: Difference between revisions
Jump to navigation
Jump to search
Content deleted Content added
| Line 28: | Line 28: | ||
<li>Use the Plot Time Series tool to see the time series of the cumulative rainfall and rainfall at a point:<br> |
<li>Use the Plot Time Series tool to see the time series of the cumulative rainfall and rainfall at a point:<br> |
||
<br> |
<br> |
||
[[File: |
[[File:Animation_M06_Results_001_01c.gif]]<br> |
||
<br> |
<br> |
||
<li>Add multiple points across the grid. Notice they all have an equal cumulative rainfall and rainfall rate applied. <br> |
<li>Add multiple points across the grid. Notice they all have an equal cumulative rainfall and rainfall rate applied. <br> |
||
<br> |
<br> |
||
[[File: |
[[File:Animation_M06_Results_001_02b.gif]]<br> |
||
<br> |
<br> |
||
<li>Use the Plot Time Series tool to see the time series of the depth and manning's n at a point and turn on the 'Manning n' map output from the Results Type to see the manning's n value change with depth:<br> |
<li>Use the Plot Time Series tool to see the time series of the depth and manning's n at a point and turn on the 'Manning n' map output from the Results Type to see the manning's n value change with depth:<br> |
||
<br> |
<br> |
||
[[File: |
[[File:Animation_M06_Results_001_03a.gif]]<br> |
||
</ol><br> |
</ol><br> |
||
Revision as of 10:40, 12 April 2023
Introduction
QGIS is used to view the cumulative rainfall and rainfall rate with the TUFLOW Viewer. For viewing of the 2D map results, see Module 1.
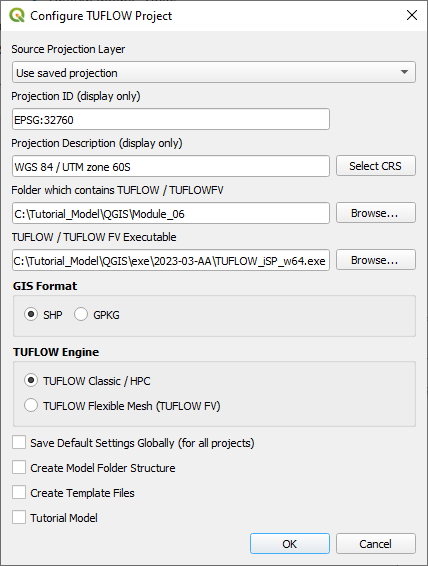
TUFLOW Project Re-Configuration
Re-configure the TUFLOW project to use and save empty files to the correct folder:
- Go to Plugins > TUFLOW > Editing > Configure / Create TUFLOW Project.
- Change the folder which contains TUFLOW to the Module_06 folder. This is the only change required, the model folder structure and template empty files are supplied from previous model.
Note: The 'results' and 'check' folder get automatically created when the TUFLOW model is run.
- Click 'OK' and save the QGIS workspace by selecting Project > Save As.
- Set the QGIS workspace projection to EPSG:32760, see Set the Projection.

Method
Inspect cumulative rainfall and rainfall rate outputs:
- Open the TUFLOW Viewer.
- Select File > Load Results. Navigate to the M06_5m_001.tcf in the Module_06\TUFLOW\runs folder and open it.
- Three additional output types appear in the Result Type panel:
- RF Cumulative: the cumulative rainfall in mm over time.
- RF Rate: the rainfall rate in mm/hr over time.
- Manning n: the Manning n values over time.
- Use the Plot Time Series tool to see the time series of the cumulative rainfall and rainfall at a point:
- Add multiple points across the grid. Notice they all have an equal cumulative rainfall and rainfall rate applied.
- Use the Plot Time Series tool to see the time series of the depth and manning's n at a point and turn on the 'Manning n' map output from the Results Type to see the manning's n value change with depth:


Conclusion
- The cumulative rainfall and rainfall rate derived from global rainfall were inspected at a point.
- The manning's n value was inspected as it varied in relation to depth.
| Up |
|---|