EXCEL setting default chart: Difference between revisions
Jump to navigation
Jump to search
Content deleted Content added
Created page with "<ol> The following steps can be used to set a default chart type in Excel. This is useful for plotting results and cross-sections from a TUFLOW model: <li>Select data in an Exce..." |
No edit summary |
||
| Line 12: | Line 12: | ||
<li>Now all you need to do to create you favourite chart is to select the data and hit the F11 key.</li> |
<li>Now all you need to do to create you favourite chart is to select the data and hit the F11 key.</li> |
||
</ol> |
</ol> |
||
{{Tips Navigation |
|||
|uplink=[[Excel_Tips| Back to Excel Tips]] |
|||
}} |
|||
Revision as of 11:38, 8 January 2026
-
The following steps can be used to set a default chart type in Excel. This is useful for plotting results and cross-sections from a TUFLOW model:
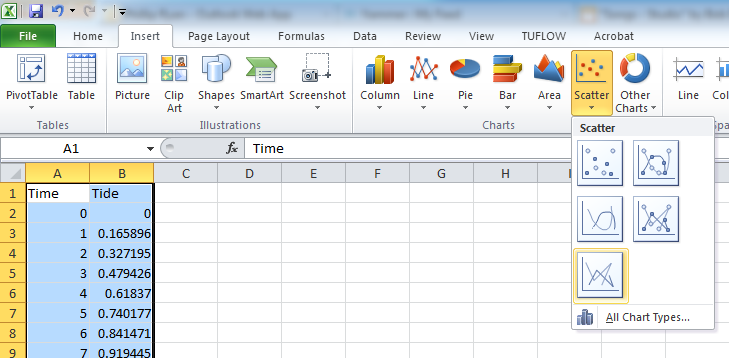
- Select data in an Excel sheet and insert your desired chart type:
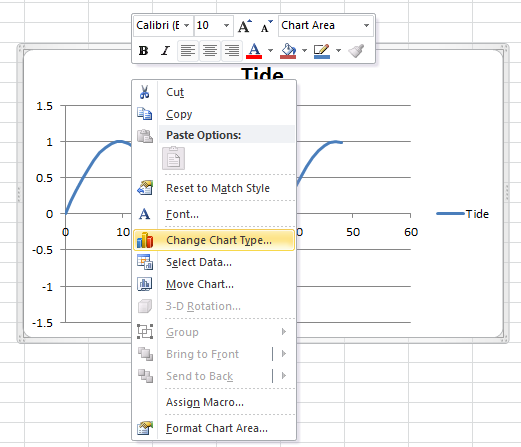
- Once the chart has been created, right click on the chart and select "Change Chart Type", as shown below:
- In the Change Chart Dialogue, click the "Set as Default Chart" option:
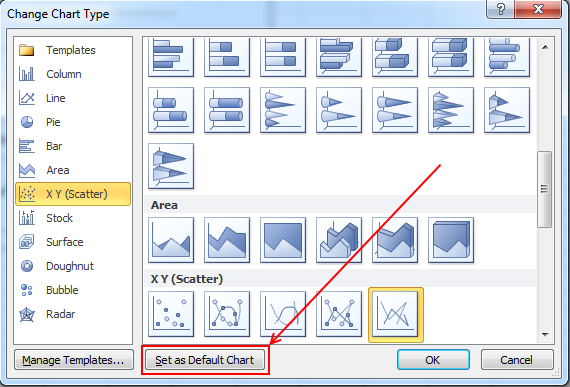
- Now all you need to do to create you favourite chart is to select the data and hit the F11 key.


| Up |
|---|