12D Model: Difference between revisions
No edit summary |
mNo edit summary |
||
| Line 40: | Line 40: | ||
==Viewing Depth, Hazard, and Velocity Contours== |
==Viewing Depth, Hazard, and Velocity Contours== |
||
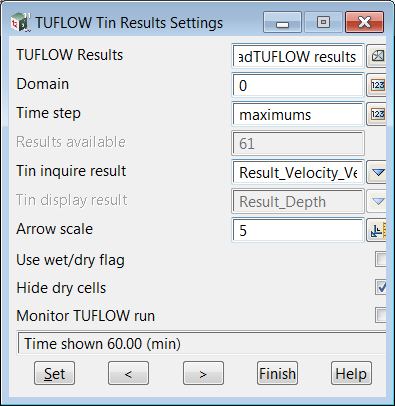
Select the '''Results Controls''' button to change what is displayed via the results grid tin. |
Select the '''Results Controls''' button to change what is displayed via the results grid tin. Change the '''Tin Inquire Results''' to '''Result Velocity Vector'''. |
||
<br> |
<br> |
||
[[File:TUFLOW Tin Results Settings Velocity Vectors.png]] |
[[File:TUFLOW Tin Results Settings Velocity Vectors.png]] |
||
<br> |
<br> |
||
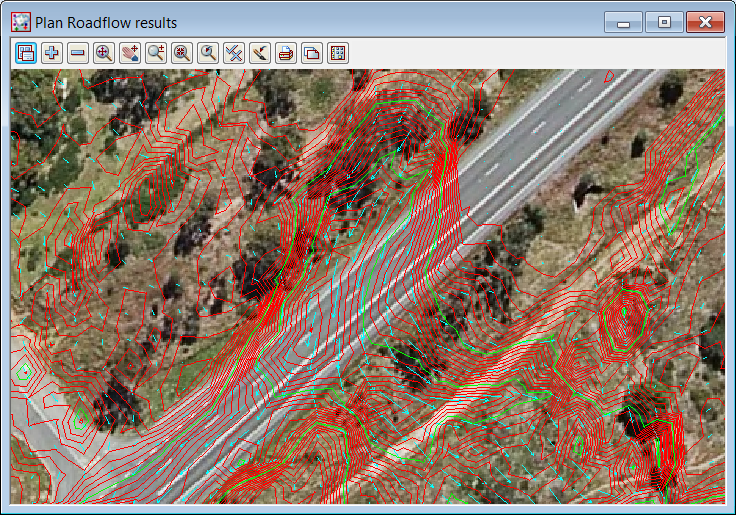
Add the '''Results tin model''' (the one you were to remember) onto a plan view and check that the contours are turned on and set as desired (F11 key). |
|||
If you also have the raster image added to the view you will see the following.<br> The 1m/s is drawn at the length in the field '''Arrow Scale'''. The colour of the arrows is the same colour as the tin (see '''Tins->Tin manager'''). |
|||
[[File:RoadflowVelocityContours.png]]<br> |
|||
One method of checking values of the contours is via '''Tin Inquire Height'''. No need to select a tin if there is only one tin on the view. Move the pointer to a contour and the velocity is displayed. |
|||
=Sections Under Construction= |
=Sections Under Construction= |
||
Revision as of 06:51, 5 June 2015
Page Under Construction
Introduction
12d model is a complete civil engineering design software including data terrain modelling, road design, sub division, railway, drainage and much more.
The water water resources modules include the 1d HEC RAS interface, 1d pipe systems (culvert and urban networks) with rational and unsteady flow hydrology and the 2d TUFLOW analysis.
12d model integrates TUFLOW with the file creation, editing and result visualisation.
Basics
Getting Started
The Roadflow interface is the quick start method of creating a TUFLOW project. It creates all of the TUFLOW files, launches the TUFLOW engine and reads the results for plan, section and 3d visualisation of results.
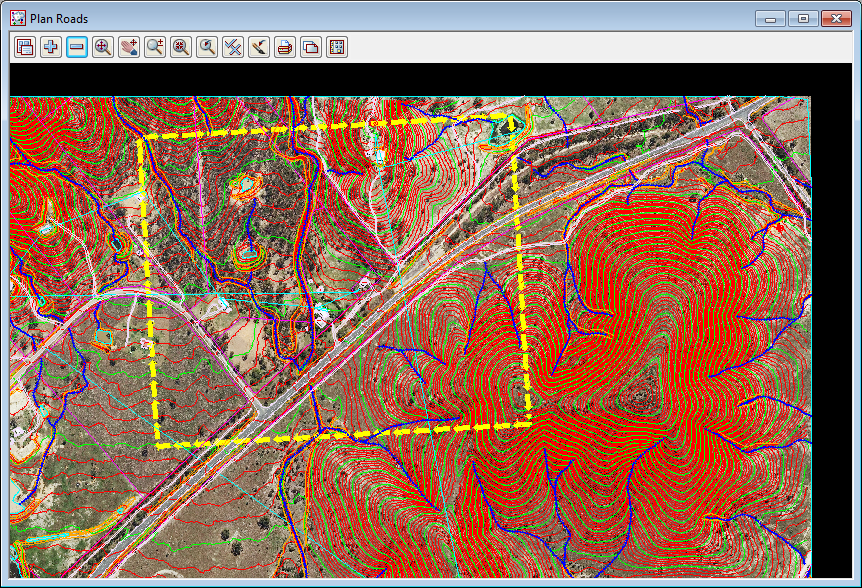
Prior to running this option you need to create a data terrain model (tin or super tin) and draw a rectangle indicating the TUFLOW grid extent. The optional data tab has further options and will be discussed later.
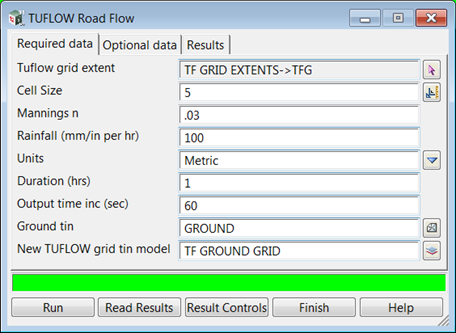
The roadflow panel is found on the menu under Design->TUFLOW->Roadflow. The rectangle is selected using the first field and the tin in entered in the second Ground tin field. The other values are typed entry as desired. Select the Run button to start the TUFLOW run.
The TUFLOW grid tin model will contain a 12d model grid tin with the centre and side elevations for the TUFLOW run.
While TUFLOW is running the usual data from the "black screen" is captured and displayed as graphed data.
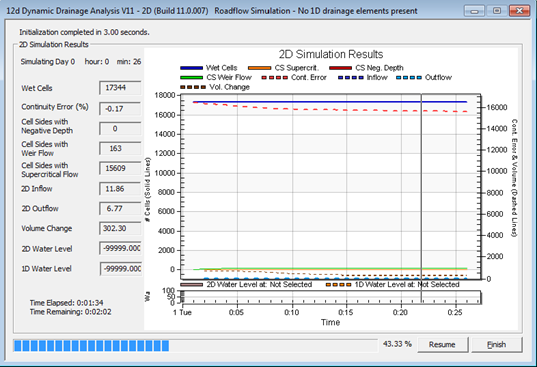
While TUFLOW is solving the results can be monitored and displayed in 12d. This will be discussed later.
When the TUFLOW run is complete, select the Read results button to link 12d to the result files for displaying. You will be instructed to select the tlf file for the run and then once again select the Read results button.
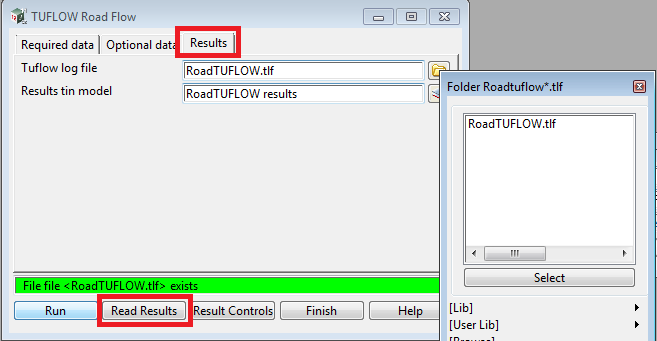
Remember the name of the Results tin model. This is the model you will add onto the views to see your results.
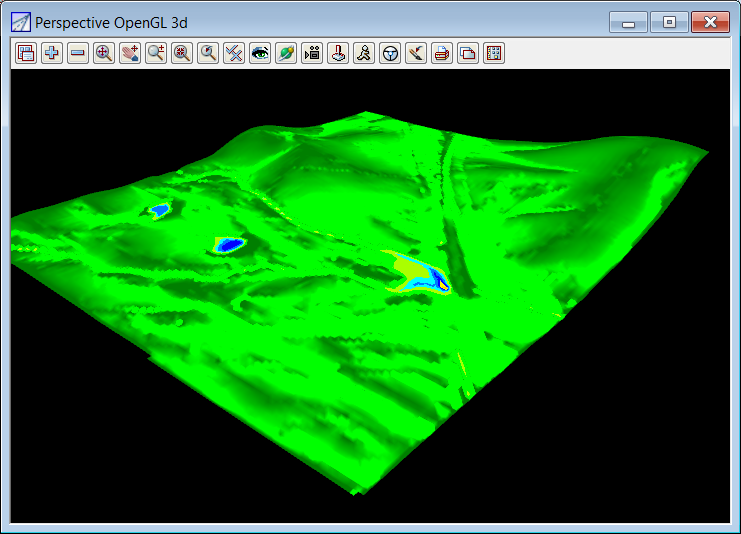
Add the Results tin model onto a 3d OpenGL view. The results tin will be set to display water levels and the perspective views will have the water surface coloured by depth.
Viewing Depth, Hazard, and Velocity Contours
Select the Results Controls button to change what is displayed via the results grid tin. Change the Tin Inquire Results to Result Velocity Vector.
Add the Results tin model (the one you were to remember) onto a plan view and check that the contours are turned on and set as desired (F11 key).
If you also have the raster image added to the view you will see the following.
The 1m/s is drawn at the length in the field Arrow Scale. The colour of the arrows is the same colour as the tin (see Tins->Tin manager).
One method of checking values of the contours is via Tin Inquire Height. No need to select a tin if there is only one tin on the view. Move the pointer to a contour and the velocity is displayed.