TuPlot: Difference between revisions
No edit summary |
No edit summary |
||
| Line 14: | Line 14: | ||
The TuPlot plotting utility relies on a python library '''TUFLOW_results2016.py''' for loading the TUFLOW results. This python based library can also be used to access TUFLOW results from python (outside of TuPlot). Please refer to [[Python_Library_TUFLOW_Results_2016 | python TUFLOW results library]] for more information and examples of this. |
The TuPlot plotting utility relies on a python library '''TUFLOW_results2016.py''' for loading the TUFLOW results. This python based library can also be used to access TUFLOW results from python (outside of TuPlot). Please refer to [[Python_Library_TUFLOW_Results_2016 | python TUFLOW results library]] for more information and examples of this. |
||
=QGIS TuPlot= |
|||
=Plotting Results= |
|||
This plotting functionality is currently accessed via QGIS. Ensure that the QGIS plugin is installed via the instructions <u>[[TUFLOW_QGIS_Plugin | on the TUFLOW QGIS plugin page]]</u>.<br> |
This plotting functionality is currently accessed via QGIS. Ensure that the QGIS plugin is installed via the instructions <u>[[TUFLOW_QGIS_Plugin | on the TUFLOW QGIS plugin page]]</u>.<br> |
||
Once this has been installed successfully QGIS can be open and the plugin accessed via the '''Plugin >> TUFLOW >> TuPlot''' menu item, or via the TuPlot button in the toolbar. The toolbar icon is shown below.<br> |
Once this has been installed successfully QGIS can be open and the plugin accessed via the '''Plugin >> TUFLOW >> TuPlot''' menu item, or via the TuPlot button in the toolbar. The toolbar icon is shown below.<br> |
||
[[File:TuPlot Icon 01.JPG]] |
[[File:TuPlot Icon 01.JPG]] |
||
<br> |
<br> |
||
==TuPlot Window== |
|||
Once the plot viewer has been opened a plot window as per the below images will be opened. The features have been numbered in the images below and a description of each is provided below.<br> |
|||
This window in QGIS is re-sizeable and dockable, you can: |
|||
* un-docked to allow this window to moved to a second monitor |
|||
* move the position of the window to a different location, e.g. below the map window |
|||
* resized as desired |
|||
<br> |
|||
[[File:TuPlot Layout1 Markup.PNG]] |
|||
<br> |
|||
''' Graphing Window of TuPlot''' |
|||
<br> |
|||
<br> |
|||
[[File:TuPlot Layout2 Markup.PNG]] |
|||
<br> |
|||
''' Options Window of TuPlot''' |
|||
<br> |
|||
The features on each of the windows is described below, with the number corresponding to the numbers in the two images above.<br> |
|||
<ol> |
|||
<li>Switch to the '''Graph''' tab of TuPlot, this is the default view</li> |
|||
<li>Switch to the '''Option''' tab of TuPlot</li> |
|||
<li>A list of the currently open results files</li> |
|||
<li>Add results only (no GIS layers), see '''Loading Results''' below for more information</li> |
|||
<li>Close results file selected in the results file list (3)</li> |
|||
<li>Add results and relevant GIS layers, see '''Loading Results''' below for more information</li> |
|||
<li>Opens an about dialogue. Also contains a link to this page</li> |
|||
<li>Allows the user to switch between time-series and long profile plotting, see below for more information on plotting time-series and long profiles</li> |
|||
<li>Check box to enable dual y axis plot</li> |
|||
<li>List of available results types to be plotted on the primary Y axis</li> |
|||
<li>List of available results types to be plotted on the secondary axis</li> |
|||
</ol> |
|||
==Loading Results== |
==Loading Results== |
||
In order to be able to visualise the results these results need to be loaded into the Plugin |
In order to be able to visualise the results these results need to be loaded into the Plugin |
||
Revision as of 12:52, 21 March 2016
THIS PAGE IS PRESENTLY BEING UPGRADED
Introduction
The TuPlot functionality is a python based tool for plotting inputs and output from TUFLOW. For the 2016 version of TUFLOW a new output format was made available, this has the following changes from previous versions:
- Combines the 1D results, 2D plot outputs and new reporting location data
- The outputs are stored in a separate Plot folder in the TUFLOW results directory
- .tpc (TUFLOW Plot Control file links to data in csv and gis folders
- Has additional Node and Channel information files contain connectivity information
This is the default approach for the 2016 version but can be modified with the TUFLOW command "Output Approach == Pre 2016" (refer to the manual for more information on this command.
The TuPlot utility is currently available as part of a QGIS plugin, however, future plans include extending this to ArcMap and as a standalone viewer.
TUFLOW Python Results Library
The TuPlot plotting utility relies on a python library TUFLOW_results2016.py for loading the TUFLOW results. This python based library can also be used to access TUFLOW results from python (outside of TuPlot). Please refer to python TUFLOW results library for more information and examples of this.
QGIS TuPlot
This plotting functionality is currently accessed via QGIS. Ensure that the QGIS plugin is installed via the instructions on the TUFLOW QGIS plugin page.
Once this has been installed successfully QGIS can be open and the plugin accessed via the Plugin >> TUFLOW >> TuPlot menu item, or via the TuPlot button in the toolbar. The toolbar icon is shown below.
TuPlot Window
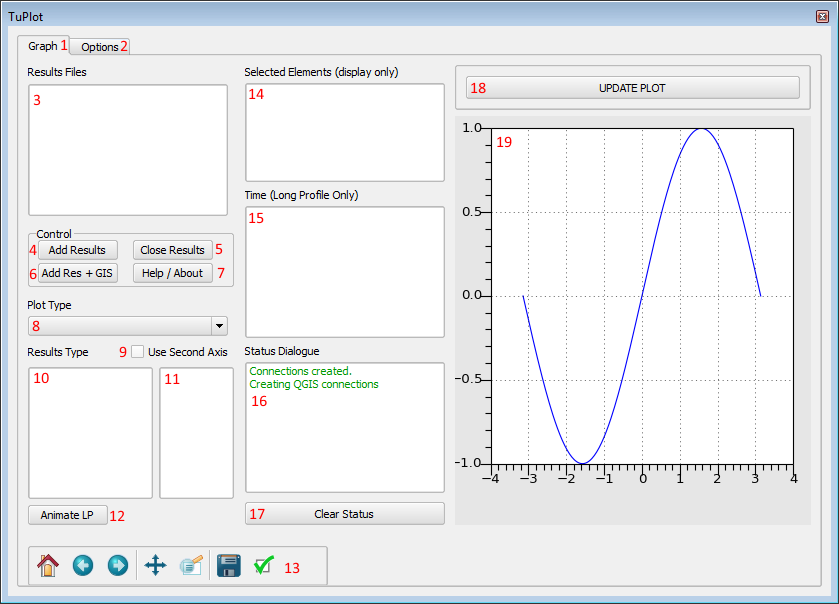
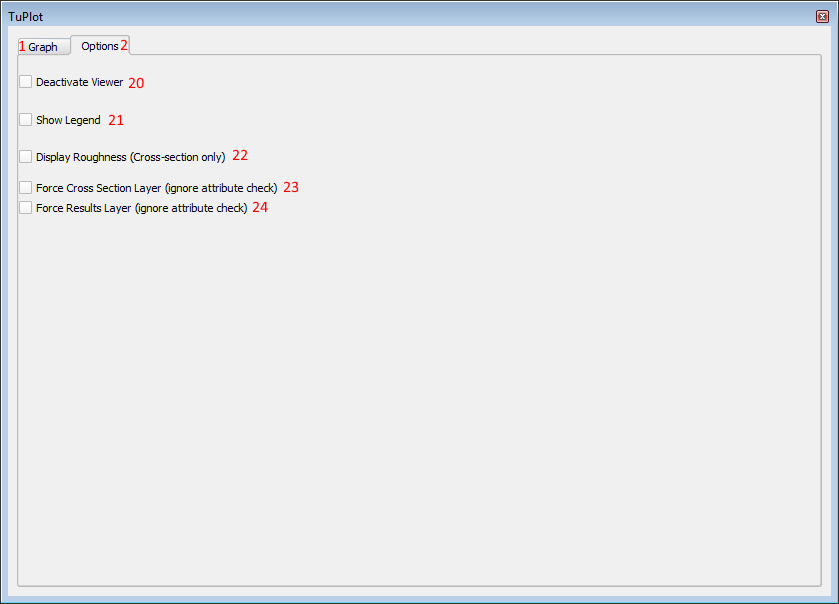
Once the plot viewer has been opened a plot window as per the below images will be opened. The features have been numbered in the images below and a description of each is provided below.
This window in QGIS is re-sizeable and dockable, you can:
- un-docked to allow this window to moved to a second monitor
- move the position of the window to a different location, e.g. below the map window
- resized as desired

Graphing Window of TuPlot

Options Window of TuPlot
The features on each of the windows is described below, with the number corresponding to the numbers in the two images above.
- Switch to the Graph tab of TuPlot, this is the default view
- Switch to the Option tab of TuPlot
- A list of the currently open results files
- Add results only (no GIS layers), see Loading Results below for more information
- Close results file selected in the results file list (3)
- Add results and relevant GIS layers, see Loading Results below for more information
- Opens an about dialogue. Also contains a link to this page
- Allows the user to switch between time-series and long profile plotting, see below for more information on plotting time-series and long profiles
- Check box to enable dual y axis plot
- List of available results types to be plotted on the primary Y axis
- List of available results types to be plotted on the secondary axis
Loading Results
In order to be able to visualise the results these results need to be loaded into the Plugin