ASC to ASC: Difference between revisions
Chris Huxley (talk | contribs) |
Ellis Symons (talk | contribs) No edit summary |
||
| Line 295: | Line 295: | ||
Example:<br> |
Example:<br> |
||
<li><tt>asc_to_asc.exe -na 1d_na_storgae_R.shp DEM_1m.flt</tt><br> |
<li><tt>asc_to_asc.exe -na 1d_na_storgae_R.shp DEM_1m.flt</tt><br> |
||
==Statistics== |
|||
<big>'''"-stat<type>"'''</big> |
|||
As of the 2017-10-AA build, the ASC_to_ASC.exe utility allows the user to perform a number of statistical analyses on a group of input grids (*.flt or *.asc format). This is particularly useful when extracting information from assessments that produce multiple result files for a single event, for example, processing grids from an ensemble assessment with numerous temporal pattern arrangements. |
|||
The available options are: |
|||
* Median |
|||
* Mean |
|||
* Frac |
|||
* Min |
|||
* Max |
|||
* All |
|||
* Rank<integer id> |
|||
The below gives a description on each option as well as an example. It is also useful to consider using wildcards in the batch file to supplement typing out each input grid file individually. Several of the examples below utilise this ability to demonstrate how it can be done.<br> |
|||
<br/> |
|||
==="-statMedian"=== |
|||
The -statMedian flag outputs the median value at each grid cell from all the input grids. All the input grids are considered, regardless of if the grid cell is dry in some of the input grids (dry areas are still ranked). |
|||
If the number of input grids is an even number, the median value is taken from the grid that is ranked ''n / 2 + 1'' (where n is the number of input grids). For example if the number of input grids is 10, at each grid cell the values are ranked lowest to highest (from 1 to 10). The result is taken from the 6th ranked grid. The median command outputs two grids: |
|||
* A value grid: the resulting median value |
|||
* An SRC grid: a grid listing which source input grid the median result value came from (a corresponding .csv file is also written as a legend)<br> |
|||
<li><tt>asc_to_asc.exe -statMedian Q100_30min_TP1_h.asc Q100_30min_TP2_h.asc Q100_30min_TP3_h.asc Q100_30min_TP4_h.asc Q100_30min_TP5_h.asc</tt><br> |
|||
[[File: asc_to_asc_statsMedian_eg.PNG|1000px|]]<br> |
|||
==="-statMean"=== |
|||
The -statMean flag outputs the mean value at each grid cell. Unlike the median, the mean is only calculated at grid cells that are wet (that show flooding) in all input grids. Please note that the source grid is the next grid above the mean value. The mean command outputs two grids: |
|||
* A value grid: the resulting value |
|||
* An SRC grid: a grid listing which source input grid the result value came from or was the next above (a corresponding .csv file is also written as a legend)<br> |
|||
<li><tt>asc_to_asc.exe -statMean Q100_30min_*_h.asc</tt><br><br> |
|||
==="-statFrac"=== |
|||
The -statFrac flag outputs a value at each grid cell that represents the fraction of the events that the grid cell is wet in. For example, if the number of input grids is 10, and a value of 0.2 is returned, this means this grid cell experienced flooding in 2 out of the 10 events. A value of 1.0 means that the grid cell was wet in all events. |
|||
The utility outputs one grid: |
|||
* A Frac grid: the resulting Fraction value<br> |
|||
<li><tt>asc_to_asc.exe -statFrac Q100_30min_*_h.asc</tt><br><br> |
|||
==="-statMin"=== |
|||
The -statMin flag outputs the minimum value at each grid cell from all the input grids. This flag is analogous with the [[#Minimum|-Min]] operation flag. |
|||
The utility outputs two grids: |
|||
* A value grid: the resulting value |
|||
* An SRC grid: a grid listing which source input grid the minimum result value came from (a corresponding .csv file is also written as a legend)<br> |
|||
<li><tt>asc_to_asc.exe -statMin Q100_30min_*_h.asc</tt><br><br> |
|||
==="-statMax"=== |
|||
The -statMax flag outputs the maximum value at each grid cell from all the input grids. This flag is analogous with the [[#Maximum|-Max]] operation flag. |
|||
The utility outputs two grids: |
|||
* A value grid: the resulting value |
|||
* An SRC grid: a grid listing which source input grid the maximum result value came from (a corresponding .csv file is also written as a legend)<br> |
|||
<li><tt>asc_to_asc.exe -statMax Q100_30min_*_h.asc</tt><br><br> |
|||
==="-statAll"=== |
|||
The -statAll flag undertakes and creates results for all the statistic operations mentioned above. |
|||
The utility outputs 9 grids: |
|||
* A median, mean, max, min and frac grid (as detailed above) |
|||
* An SRC grid: for the median, mean, min and max calculations (calculation of source grids as detailed above) |
|||
* A .csv file that contains the legend for all SRC grids<br> |
|||
<li><tt>asc_to_asc.exe -statAll Q100_30min_*_h.asc</tt><br><br> |
|||
==="-statRank<integer id>"=== |
|||
The -statRank<integer> flag outputs the ''n<integer>'' ranked value at each grid cell from all the input grids. All the input grids are considered, regardless of if the grid cell is dry in some of the input grids (dry areas are still ranked). For example, if the number of input grids is 10, at each grid cell the values are ranked lowest to highest (from 1 to 10). -statRank8 will output results taken from the 8th ranked grid. In this example, -statRank1 is equivalent to ''Min'', -statRank10 is equivalent to ''Max'', and -statRank6 is equivalent to ''Median''. The Rank flag allows additional functionality that lets users extract results in between those that are pre-programmed. |
|||
The utility outputs one grid: |
|||
* A value grid: the resulting value |
|||
* An SRC grid: a grid listing which source input grid the ranked result value came from (a corresponding .csv file is also written as a legend)<br> |
|||
<li><tt>asc_to_asc.exe -statRank5 Q100_30min_*_h.asc</tt><br><br> |
|||
=Other Options (switches)= |
=Other Options (switches)= |
||
Revision as of 09:16, 10 November 2017
- asc_to_asc.exe -conv *.flt
Converts all .flt grids to .asc format.
- asc_to_asc.exe -conv DEM_M01.asc
Converts the file "DEM_M01.asc" for .flt format.Maximum
"-max"
Determines the maximum value in all the input .asc files. Two output grids are created:
- A numerical grid containing the maximum value.
- A classified grid with the name _src.asc which contains the source grid for the maximum value.
- A numerical grid containing the maximum value.
- asc_to_asc.exe -max Q100_30min_h.asc Q100_45min_h.asc Q100_60min_h.asc
Creates a new grid containing the maximum of the 3 input water level grids. - asc_to_asc.exe -out Q100_Max_Levels.asc -max Q100_30min_h.asc Q100_45min_h.asc Q100_60min_h.asc
As per item 2 above, but specifies the output name "Q100_Max_Levels.asc". - The first is the difference values between the two .asc files. A difference value only occurs at grid cells that have a value in both grids. If the cell has a null value (ie. the TUFLOW output was dry at that location) in either or both .asc grids, a null value is output.
- A second grid with a “_wd” suffix is output to indicate which .asc grid cells were either previously wet and are now dry or vica versa. Importing this grid into Vertical Mapper creates a .grc (grid classification) grid that has two categories: “Was Wet Now Dry” and “Was Dry Now Wet”. This grid is particularly useful for displaying areas that were previously inundated or previously flood-free.
- asc_to_asc.exe -out difference.asc -dif after_h.asc before_h.asc
Creates new grids comparing the differences in flood levels and extents for:
"difference.asc" = "after_h.asc" - "before_h.asc" - If only one grid is specified this grid is processed.
- If two grids are specified, the first value is used for setting the cutoff depth and the values from the second grid are processed.
- If three grids are specified, the third grid is used for setting the filename for the output grid. This is ignored if the "-out" option is used.
- asc_to_asc.exe -cd0.1 depth.asc
Creates a new depth grid only where the depth is greater than 0.1m. - asc_to_asc.exe -cd0.1 depth.asc levels.asc
Creates a new level grid only where the depth is greater than 0.1m. - asc_to_asc.exe -cd0.1 -out filtered_levels.asc depths.asc levels.asc
As per the example above, but sets the output name as "filtered_levels.asc". - asc_to_asc.exe -resize5 -out DEM_10m.asc DEM_2m.asc
Creates a new 10m DEM (DEM_10m.asc) based on the the 2m DEM using an averaging approach. - asc_to_asc.exe -resize5 -rm_min -out DEM_10m_min.asc DEM_2m.asc
Creates a new 10m DEM (DEM_10m_min.asc) based on the the 2m DEM using an minimum approach. - asc_to_asc.exe -resize5 -rm_max -out DEM_10m_max.asc DEM_2m.asc
Creates a new 10m DEM (DEM_10m_max.asc) based on the the 2m DEM using an maximum approach. - asc_to_asc.exe -trans_m0.3048 DEM.asc
Multiplies all values by 0.3048. - asc_to_asc.exe -trans_m0.3048 -trans_c10 DEM.asc
Multiplies all values by 0.3048 and then adds 10.0. - asc_to_asc.exe -classify classifications.csv results_VMax.asc
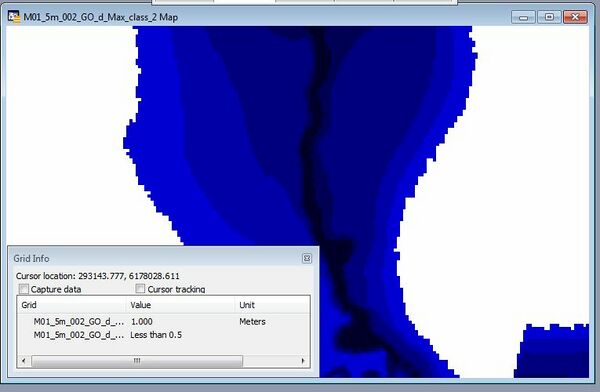
Outputs a classified grid, based on the cut off values and names in the "classifications.csv". - asc_to_asc.exe -RGB -grc -classify depth_classify.csv results_dMax.asc
Cutoff Value Name R G B 0.5 Less than 0.5 0 0 192 1.0 0.5 to 1.0 0 0 128 2.0 1.0 to 2.0 0 0 64
In the image below two grids are shown in MapInfo / Vertical Mapper, one is classified without the -grc option and a class number is returned for the grid. The second grid has been created with the -grc option shown, when querying this the label is returned instead.
Extract Breaklines from DEM
"-brkline <gis file in 2d_zsh format>"
This feature was added to the 2013-06-AA version of the utility.
Extracts elevations from a DEM for breaklines in the 2d_zsh format. This GIS input should have four attributes, z, dz, width and shape_options, as described in the TUFLOW manual. For the utility the dz, shape_width and the shape_options are used. Valid shape_options are "Max" and "Min" or blank (average used). The utility will extract an elevation at each vertex along the line. Depending on the line width and DEM cell size, the following methods are used:
- If the width is set to 0, the closest DEM value to the vertex is used. If a "shape_option" is specified this is ignored.
- If the width is greater than 0, but less than 1.5 times the DEM cell size, the four DEM values surrounding the vertex are used. If max or min is specified in the "shape_option" the max or min of the four values is used. If max or min option is not specified (attribute is blank), the average of the four values is used.
- If the width is greater than 1.5 times the DEM cell size, at each vertex a buffer region is created and all non null DEM values within the buffer object are processed. The diameter of the buffer region is equal to the width specified. If max or min option is not specified, the average of the values within the region is used. These buffer regions are outputted as a separate file.
If a dz value is specified (for the 2014-01-AA version or later) this can be used to control the spacing of vertices along the line. If a dz value of 100 is specified the maximum spacing along the line is 100 (metres or feet), if the existing vertices along the line are greater than 100 (m or ft) apart additional vertices are inserted. The method for inserting additional vertices creates equally spaced vertices. For example, if two vertices along a line are spaced 250m apart and a dz attribute of 100m is specified three line segments of 83.3m will be created as opposed to two segments of 100m and one segment of 50m.
NOTE: For the output GIS file, the dz attribute is set to 0.0 regardless of the value set in the input field.Example:
- asc_to_asc.exe -brkline 2d_zsh_breaklines_L.shp DEM.asc
Fuzzy Map
"-fuzzy <input grids>"
This feature was added to the 2014-03-AB version of the utility.
A fuzzy map can be used when comparing a large number of simulations.
For each input grid (or scenario) the grid is classed as either 1 if the results grid is wet or 0 if dry. The total score for each grid cell is is calculated and then divided by the total number of input grids. A value of 1 indicates that the cell was wet in each simulation a value of 0 is dry in all simulations. Grids with a value of 0.5 are most sensitive.
This can be useful for quantifying the sensitivity of the model to parameters.
Example:
- asc_to_asc.exe -fuzzy *_d_Max.flt
Create a fuzzy map from all maximum depth grids in the directory.Histogram
"-histogram bins.csv <input grid>"
This feature was added to the 2014-03-AB version of the utility.
Calculates the number of cells and percentage of cells that fall in each range. Requires and input .csv file containing the bin values.
An example inputs bin file is:
Bin Label 0.25 Less than 0.25 0.5 0.25 to 0.50 1.0 0.5 to 1.0 2.0 1.0 to 2.0 3.0 2.0 to 3.0 5.0 3.0 to 5.0 An example output looks like the below:
Bin Label Count Percentage 0.25 Less than 0.25 986,434 58.61 0.5 0.25 to 0.50 334,422 19.87 1.0 0.5 to 1.0 216,449 12.86 2.0 1.0 to 2.0 118,452 7.04 3.0 2.0 to 3.0 10,206 0.61 5.0 3.0 to 5.0 15,998 0.95 Above 5.0 Above 5.0 973 0.06
Example: - asc_to_asc_w64.exe –histogram histogram_bins.csv results_d_Max.asc
- Min
- Max
- Average (default)
- Point {default} - Value at the cross-section point is used.
- Buffer - circular buffer region around each cross-section point is created and elevation is extracted from this, using Min, Max or Average as described above.
- Perpendicular - A line perpendicular to section direction is used and elevation is extracted from this, using Min, Max or Average as described above. This can be useful if the section follows a hydraulic control (such as embankment) to ensure that the high / or low point is extracted.
- asc_to_asc.exe -egc MR_1d_001.egc
An example .egc file is:
Read GIS Branch == 1d_br_MR_001.MIF
Read GIS XS == 1d_cut_MR_001.MIF
Output Nwk == 1d_nwk_MR_001.MIF
Output XS == 1d_xs_MR_001.MIF
Write NWK == ON !Write 1d_nwk layer
Write XS == ON !Write 1d_xs layer

Set XS dx == 5 !set default spacing, can be specified on xs or cut line

Set XS Mat == 1 !default Material ID of 1
Read Grid Mat == grid\grid_5m_2d_mat_MR_001.flt

Set XS Z == 99
Read Grid Z == grid\dem_5m_regional.flt
Read Grid Z == grid\dem_1m_bathymetry.flt
Read Grid Z == grid\dem_1m_survey.flt
Extract 1D Nodal Area Tables from Grid
"-na <gis_region_file> <input grid>"
Can be used to extract nodal-area (elevation-area) tables from a DEM, and output these in a .csv file format suitable for input into the 1D domain of a TUFLOW model.
The input GIS region file should have the same attributes as the 1d_tab file format produced by TUFLOW. The first attribute ("Source" ) should contain a valid .csv file name.
The out nodal area table extends from the minimum to the maximum elevation in the DEM. A user defined minimum value can be specified using the "Skew" attribute of the GIS region.
Example:
- asc_to_asc.exe -na 1d_na_storgae_R.shp DEM_1m.flt
Statistics
"-stat<type>"
As of the 2017-10-AA build, the ASC_to_ASC.exe utility allows the user to perform a number of statistical analyses on a group of input grids (*.flt or *.asc format). This is particularly useful when extracting information from assessments that produce multiple result files for a single event, for example, processing grids from an ensemble assessment with numerous temporal pattern arrangements.
The available options are:
- Median
- Mean
- Frac
- Min
- Max
- All
- Rank<integer id>
The below gives a description on each option as well as an example. It is also useful to consider using wildcards in the batch file to supplement typing out each input grid file individually. Several of the examples below utilise this ability to demonstrate how it can be done.
"-statMedian"
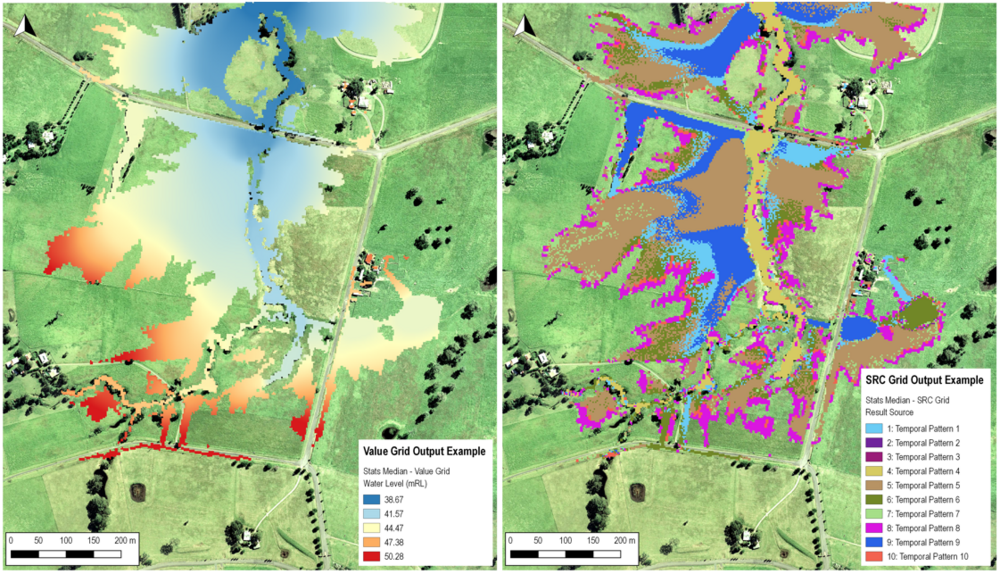
The -statMedian flag outputs the median value at each grid cell from all the input grids. All the input grids are considered, regardless of if the grid cell is dry in some of the input grids (dry areas are still ranked).
If the number of input grids is an even number, the median value is taken from the grid that is ranked n / 2 + 1 (where n is the number of input grids). For example if the number of input grids is 10, at each grid cell the values are ranked lowest to highest (from 1 to 10). The result is taken from the 6th ranked grid. The median command outputs two grids:
- A value grid: the resulting median value
- An SRC grid: a grid listing which source input grid the median result value came from (a corresponding .csv file is also written as a legend)
- asc_to_asc.exe -statMedian Q100_30min_TP1_h.asc Q100_30min_TP2_h.asc Q100_30min_TP3_h.asc Q100_30min_TP4_h.asc Q100_30min_TP5_h.asc
"-statMean"
The -statMean flag outputs the mean value at each grid cell. Unlike the median, the mean is only calculated at grid cells that are wet (that show flooding) in all input grids. Please note that the source grid is the next grid above the mean value. The mean command outputs two grids:
- A value grid: the resulting value
- An SRC grid: a grid listing which source input grid the result value came from or was the next above (a corresponding .csv file is also written as a legend)
- asc_to_asc.exe -statMean Q100_30min_*_h.asc
"-statFrac"
The -statFrac flag outputs a value at each grid cell that represents the fraction of the events that the grid cell is wet in. For example, if the number of input grids is 10, and a value of 0.2 is returned, this means this grid cell experienced flooding in 2 out of the 10 events. A value of 1.0 means that the grid cell was wet in all events.
The utility outputs one grid:
- A Frac grid: the resulting Fraction value
- A Frac grid: the resulting Fraction value
- asc_to_asc.exe -statFrac Q100_30min_*_h.asc
"-statMin"
The -statMin flag outputs the minimum value at each grid cell from all the input grids. This flag is analogous with the -Min operation flag.
The utility outputs two grids:
- A value grid: the resulting value
- An SRC grid: a grid listing which source input grid the minimum result value came from (a corresponding .csv file is also written as a legend)
- asc_to_asc.exe -statMin Q100_30min_*_h.asc
"-statMax"
The -statMax flag outputs the maximum value at each grid cell from all the input grids. This flag is analogous with the -Max operation flag.
The utility outputs two grids:
- A value grid: the resulting value
- An SRC grid: a grid listing which source input grid the maximum result value came from (a corresponding .csv file is also written as a legend)
- asc_to_asc.exe -statMax Q100_30min_*_h.asc
"-statAll"
The -statAll flag undertakes and creates results for all the statistic operations mentioned above.
The utility outputs 9 grids:
- A median, mean, max, min and frac grid (as detailed above)
- An SRC grid: for the median, mean, min and max calculations (calculation of source grids as detailed above)
- A .csv file that contains the legend for all SRC grids
- asc_to_asc.exe -statAll Q100_30min_*_h.asc
"-statRank<integer id>"
The -statRank<integer> flag outputs the n<integer> ranked value at each grid cell from all the input grids. All the input grids are considered, regardless of if the grid cell is dry in some of the input grids (dry areas are still ranked). For example, if the number of input grids is 10, at each grid cell the values are ranked lowest to highest (from 1 to 10). -statRank8 will output results taken from the 8th ranked grid. In this example, -statRank1 is equivalent to Min, -statRank10 is equivalent to Max, and -statRank6 is equivalent to Median. The Rank flag allows additional functionality that lets users extract results in between those that are pre-programmed.
The utility outputs one grid:
- A value grid: the resulting value
- An SRC grid: a grid listing which source input grid the ranked result value came from (a corresponding .csv file is also written as a legend)
- asc_to_asc.exe -statRank5 Q100_30min_*_h.asc
Other Options (switches)
A list of the general switches is provided in the table below, these are available for all operations listed above:
Switch Description "-b" Run the utility in batch mode, this suppresses the prompt to press enter at the end of processing. Used in .bat files where two or more files are to be processed. The -b flag should be placed after the asc_to_asc.exe call, before the function command. For example:
asc_to_asc.exe -b -brkline 2d_zsh_breaklines_L.shp DEM.asc
"-out <output grid name>" Specify the output filename for the new grid.
Note: a space is required between the -out and the filename."-flt" Set the output grid format to binary float (.flt). "-asc" Set the output grid format to ESRI ascii format (.asc). "-grc" For use with the "-classify" option and .asc format output. This creates a classified grid (uses name rather than number). This is only valid if using Vertical Mapper, neither QGIS or ArcMap will recognise this format. This can also be used with the -RGB option to specify the output colouring of your grid.
Introduction
asc_to_asc.exe is a utility that can be used to perform a range of operations on gridded files. The input grids can be either ESRI ASCII grid (.asc) or binary float grids (.flt), both of which can be input and output from TUFLOW.
This utility is useful for comparing and processing TUFLOW outputs from different .2dm meshes, which can't be compared with the res_to_res.exe.
For some options (such as processing maximums or differences) the input (.asc or .flt) files must be of the same row/column dimensions.
The inputs can be a combination of .asc and .flt grids and the -asc or -flt options can be used to set the output type.
For a complete list to the operations available, please see the table of contents above.
Operations
Convert
"-conv"
Converts between .flt and .asc format. For this operation the output file type is based on the input, for an input .asc file the output will be in .flt format.
Example:
Difference
"-dif"
Takes the difference between the first two .asc files, the second grid is subtracted from the first. If an optional third .asc file is specified, this is used as the output file, otherwise, asc_to_asc creates its own output filename using the names of the two input .dat files. The output is the first .asc file minus the second .asc file.
Two .asc grids are output:
Cutoff Depth
"-cd<cutoff value>"
Outputs a new file only where the value is greater than the cutoff value.
Resize
"-resize<factor>"
Resize the grid based on the factor above. The factor must be an integer (greater than 1). The output grid has the same origin (lower left) coordinates as the input grid. The new cell size is the factor times the old cell size. For example if a -resize5 is used on a 2m resolution grid the output grid will be 10m. For processing the grid three options are available
Average (default)
This is the defualt processing method, which can also be specified with the -rm_avg (resize method - average) input flag. When processing for each tile in the new grid, the average of all non-null values in the input grid is taken. For example with a resize factor of 5, the 25 values in the input grid are averaged.
Minimum
Alternative processing method for resize, specified with the -rm_min (resize method - minimum) flag. At each output grid the values is the minimum of the values in the input grid.
Maximum
Alternative processing method for resize, specified with the -rm_max (resize method - maximum) flag. At each output grid the values is the maximum of the values in the input grid.
Transform
Transforms the values using a simple y = mx + c approach the multiplier (m) is specified with flag -trans_m<value>. The add value (c)-trans_c<value>. Only one values is required to be specified.
Classify
Classifies the grid based on the input classifications. The output file is a classified .asc grid. The classification .csv file should have two columns cutoff value and name (in that order). The first line in .csv treated as a header line and ignored. Any values over the greatest cutoff with be outputted to class "above".
| Cutoff Value | Name |
|---|---|
| 0.5 | Less than 0.5 |
| 1.0 | 0.5 to 1.0 |
| 2.0 | 1.0 to 2.0 |
If using vertical mapper the -grc option can be used to create the .asc file in classified grid format, in this format rather than storing a numerical value when interrogating an area a label is returned. This format is not recognised by ArcMap or QGIS. If using the grc option it is also possible to specify the desired RGB (red, green, blue) values for the output grid in the .csv file used for the classification. The RGB values should be specified in the 3-5th columns of the .csv file.

Extract 1D Model Inputs
"-egc control_file.egc"
This allows 1D Network (1d_nwk) and/or 1D Cross-Sections to be extracted from a series of grids.
A simple input file similar to the TUFLOW geometry control file is input into the utility. This is nominally given the extension .egc (Estry Geometry Control).
Two input GIS layers can be used, these are the branch lines (channels) and cut lines (cross sections). The branch line is split into the 1d_nwk layer, a new 1D channel is created for each section. The GIS attributes of these are defined in the sections below.
Branch Lines
The branch lines are split into channels using the cross-section cut lines detailed below. A number of channel characteristics can be set for branch lines. The required attribute names and data types for branch line are as follows:
| Attribute (type) | Description |
|---|---|
| Name (character 10) | Sets the branch name, unique chainage identifier is added to all output channels. |
| n_or_nF (float) | Sets the output "n_or_nF" attribute for all output channels in the 1d_nwk layer. |
| UCS (float) | Sets the "UCS" attribute for all output channels in the 1d_nwk layer. |
| FLC (float) | Sets the "FLC" attribute for all output channels in the 1d_nwk layer. If a value of greater than 0 is specified the FLC is split between channels within the branch. For example if 0.5 is specified and the branch is split into 10 channels, each channel will have an output "Form_Loss" of 0.05. |
| ChanType (character 4) | Sets the "Type" attribute for all output channels in the 1d_nwk layer. If left blank a default channel type of "S" is applied. |
Cut Lines
For each line in the cut line layer a cross-section will be extracted and output into .csv file format ready for use in TUFLOW. A number of cross section characteristics can be set for each cut line. The required attributes for the cross-section cut line are:
| Attribute (type) | Description |
|---|---|
| Source (character 50) | Optional output cross-section file name. If left blank the name and chainage of the branch the cross-section intersects is used. |
| Distance (float) | Optional distance along the line for sampling from grids. If not specified the value specified in the .egc file is used. |
| Split (character 1) | "T" (True) or "F" (False) for splitting the branch, set to false and the branch will not be split (used for centre sections) |
| Extract_XS (character 1) | "T" (True) or "F" (False) for cross-section extraction. If set to "F" no cross-section is extracted for the cut line. |
| Extract_Method (character 50) | Specify the method for extract the elevations from the grid (does not apply to Material grids). Options are: |
| Buffer_Method (character 50) | Optional method for extracting the elevations from the grid (does not apply to Material grids) values from grid. Options are: |
| Buffer_Distance (float) | Sets the distance for when using the "Buffer" or "Perpendicular" methods above. |
EGC commands
The .egc file is read in a similar manner to the .tgc (TUFLOW geometry control) file. This file is read in a sequential order and for repeated commands the final one prevails.
A full list of the availble .egc commands is detailed in the table below.
| Attribute (type) | Description |
|---|---|
| Read GIS Branch == <1d_br GIS file> | Reads the branch lines, these are described above. |
| Read GIS XS == <1d_cut GIS file> | Reads the cross-section cut lines, these are described above. |
| Read GIS FLC == <GIS file> | Optional GIS layer of polygons that can be used to specify form loss coefficients to the 1d_nwk layer. A single GIS (float) attribute is required. A FLC value of greater than 0 will be split between all 1d_nwk channels within the region. A FLC value of less than 0, will apply the absolute value to all channels within the polygon. For example if an FLC value of -0.1 is specified, all channels that fall within the polygon will have a form_loss attribute of 0.1. If a channel falls within multiple polygons, the form loss values will be added.
Reads the polygons off losses from GIS layer. cross-section cut lines, these are described above. |
| Set XS dx == <distance> | Sets the default distance across section to extract elevations and materials data. This can be specified on the cut lines as detailed above. |
| Set XS Z == <elevation> | Sets the elevation for all points in all cross-sections. |
| Set XS Mat == <Material ID> | Sets the material ID for all points in all cross-sections. |
| Read Grid Z == <grid layer of elevations> | Read elevations from DEM and assign this to all cross-section extraction points that fall within active DEM pixels. |
| Read Grid Mat == <grid layer of Material IDs> | Read material IDs from raster grid and assign this to all cross-section extraction points that fall within active DEM pixels. This should be an integer grid. |
| Write XS == ON or OFF | Turns on or off the writing of the 1d_xs layer. The default is off. |
| Write NWK == ON or OFF | Turns on or off the writing of the 1d_nwk layer. The default is off. |
| Output XS == <output gis layer> | Sets the output GIS layer for the 1D cross-sections. |
| Output NWK == <output gis layer> | Sets the output GIS layer for the 1D channel cross-sections. |
| Output NWK == <output gis layer> | Sets the output GIS layer for the 1D channel cross-sections. |
| FLC per Unit Length == <form loss per unit length> | The form loss per unit length is written to the "exit_loss" attribute of all 1d_nwk channels. |
Example:

| Up |
|---|