Tutorial M09 Results QGIS: Difference between revisions
Jump to navigation
Jump to search
Content deleted Content added
| Line 33: | Line 33: | ||
=Conclusion= |
=Conclusion= |
||
:*The results of all event magnitudes and durations were inspected using the TUFLOW Viewer. |
:*The results of all event magnitudes and durations were inspected using the TUFLOW Viewer. |
||
:*For further functionality, see <u>[[TUFLOW_Viewer | TUFLOW Viewer]]</u>.<br> |
|||
<br> |
<br> |
||
Revision as of 11:19, 13 April 2023
Introduction
QGIS is used to load and view a range of event magnitudes and durations with the TUFLOW Viewer. For viewing of the 2D map results, see Module 1.
TUFLOW Project Re-Configuration
Re-configure the TUFLOW project to use and save empty files to the correct folder:
- Go to Plugins > TUFLOW > Editing > Configure / Create TUFLOW Project.
- Change the folder which contains TUFLOW to the Module_09 folder. This is the only change required, the model folder structure and template empty files are supplied from previous model.
Note: The 'results' and 'check' folder get automatically created when the TUFLOW model is run.
- Click 'OK' and save the QGIS workspace by selecting Project > Save As.
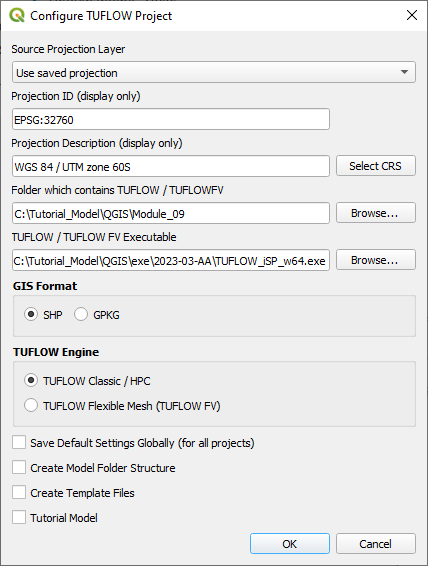
- Set the QGIS workspace projection to EPSG:32760, see Set the Projection.

Method
Inspect the results for all events:
- Open the TUFLOW Viewer.
- Load the results using the TCF. From File > Load Results, navigate to the Module_09\TUFLOW\runs folder and select the following file:
- M09_5m_~e1~_~e2~_001.tcf
- When prompted, click 'Select All' and 'Ok'. The TUFLOW Viewer opens all six simulation runs using event management:
- Inspect the extent, water level and the flows plot output for each event:


Conclusion
- The results of all event magnitudes and durations were inspected using the TUFLOW Viewer.
- For further functionality, see TUFLOW Viewer.
| Up |
|---|