Green-Ampt Infiltration Parameters
PAGE UNDER CONSTRUCTION
Introduction
There are a number of methods available within TUFLOW to infiltrate water on the 2D surface into the sub-surface. These are Green-Ampt, Horton and Initial Loss/Continuing Loss. The models are used to represent hydrological losses particularly when direct rainfall is applied directly to the 2D surface and runoff is generated. As such, the infiltration module used, and the parameters selected, are important calibration parameters which should be used to calibrate simulated flows to observed flows.
Green-Ampt Infiltration
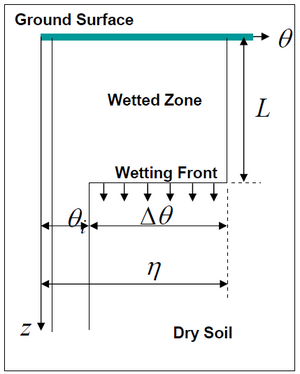
The Green-Ampt approach varies the rate of infiltration over time based on the soil’s hydraulic conductivity, suction, porosity and initial moisture content. The method assumes that as water begins to infiltrate the soil, a line is developed differentiating between the ‘dry’ soil with moisture content θ_i) and the ‘wet’ soil (with moisture content equal to the porosity of the soil η). As the infiltrated water continues to move through the soil profile in a vertical direction, the soil moisture changes instantly from the initial content to a saturated state. This concept is shown in Figure 1.
Figure 1 Green-Ampt Model Concept
Figure courtesy of University of Texas
The basic form of the Green-Ampt equation is expressed as follows:

Where:
- t is time
- K is the saturated hydraulic conductivity
- ∆θ is defined as the soil capacity (the difference between the saturated and initial moisture content)
- φ is the soil suction head
- h0 is the depth of ponded water
- F(t) is the cumulative infiltration calculated from:
United States Department of Agriculture (USDA) soil types have been hardwired into TUFLOW and are presented in Table 1 along with the soil parameters. Alternatively, it is possible to define a customised soil type by specifying user defined values within the tsoilf.
Table 1 USDA Soil types for the Green-Ampt Infiltration Method (from Rawls, W, J, Brakesiek & Miller, N, 1983, ‘Green-Ampt infiltration parameters from soils data’, Journal of Hydraulic Engineering, vol 109, 62-71.)
| USDA Soil Type | Suction (mm) | Hydraulic Conductivity (mm/hr) | Porosity (Fraction) |
| Clay | 316.3 | 0.3 | 0.385 |
| Silty Clay | 292.2 | 0.5 | 0.423 |
| Sandy Clay | 239 | 0.6 | 0.321 |
| Clay Loam | 208.8 | 1 | 0.309 |
| Silty Clay Loam | 273 | 1 | 0.432 |
| Sandy Clay Loam | 218.5 | 1.5 | 0.33 |
| Silt Loam | 166.8 | 3.4 | 0.486 |
| Loam | 88.9 | 7.6 | 0.434 |
| Sandy Loam | 110.1 | 10.9 | 0.412 |
| Loamy Sand | 61.3 | 29.9 | 0.401 |
| Sand | 49.5 | 117.8 | 0.417 |
Table 2 presents summary statistics for the Green-Ampt Parameters types.
Table 2 USDA Summary Statistics for all Soil types for the Green-Ampt Infiltration Method
| Stat | Suction (mm) | Hydraulic Conductivity (mm/hr) | Porosity (Fraction) |
| Min | 49.5 | 0.3 | 0.31 |
| Max | 316.3 | 117.8 | 0.49 |
| Mean | 184.04 | 15.86 | 0.4 |
| SD | 94.82 | 34.92 | 0.05 |
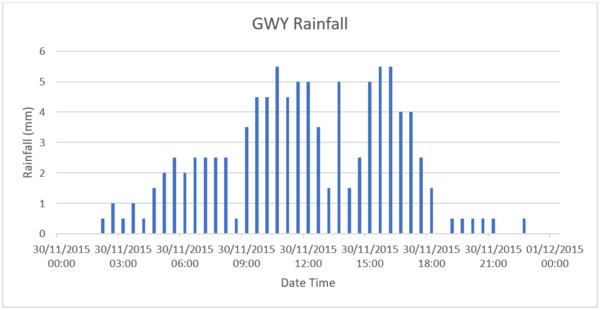
The comparison has been undertaken on a real-world whole catchment model of the Plynlimon catchment in mid-Wales. The model was run with a real rainfall event from 2015 with a temporal resolution of 30 minutes as shown in Figure 2.
Figure 2: Plynlimon Rainfall
For the purposes of this sensitivity analysis of the parameters a single soil type was used representing the general clay soil types that are present.
Green-Ampt Infiltration: User Parameters
Where the inbuilt USDA soil types, are not used, the user can specify their own values for the Suction, Hydraulic Conductivity, Porosity, Initial Soil Moisture and max ponding depth. What follows is a description of each parameter and the sensitivity to a low, medium and high value based on the USDA soil type values.
Capillary Suction Head
The suction head, represented in millimeters, is the capillary attraction on the soil voids. It is large for fine grain soils such as clays and smaller for sandy soils.
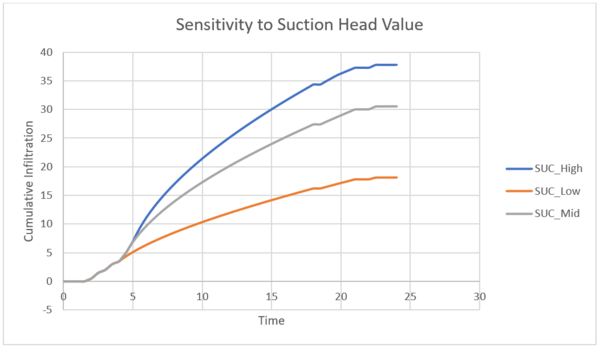
To test the sensitivity of the simulated runoff at a gauged location, a low (49.5), mid representing the mean (184.4) and high (316.3) value of the suction head parameter were used with other parameters representing a clay soil (soil type 1).
The larger the value the capillary suction head value, the more capillary action that is achieved and the amount of infiltration that takes place. This is shown by the increase in cumulative infiltration in the graph below with a greater cumulative infiltration for the increase in the suction head.
Figure 3: Sensitivity of cumulative infiltration in the Plynlimon Gwy catchment to the Capillary Suction Head parameter in the Green-Ampt infiltration model.
As a consequence of this, there is a less runoff generated as shown in Figure 4. The model is not particularly sensitive to the suction head parameter and this fits with observations made within the literature.
Figure 4: Sensitivity of simulated flow at the Cefn-Brwn gauge location in the Plynlimon Gwy catchment to the Suction head parameter in the Green-Ampt infiltration model.
It can also be seen that the higher the suction head value that the longer it takes the hydrograph to start rising, with the high suction head scenario less responsive to the rainfall
Saturated Hydraulic Conductivity
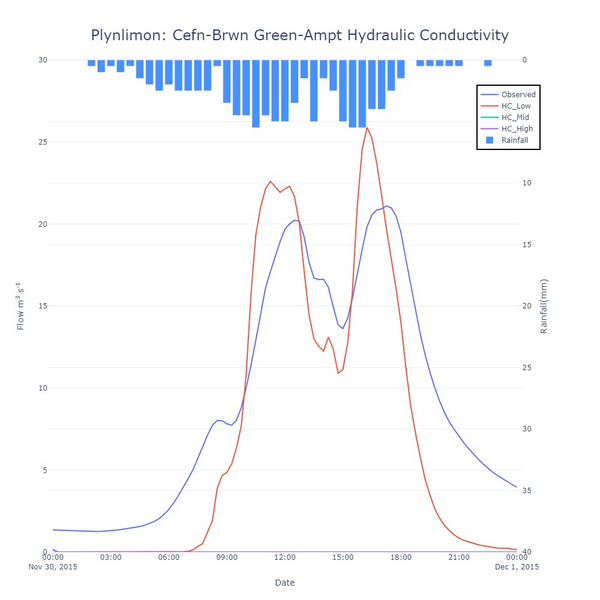
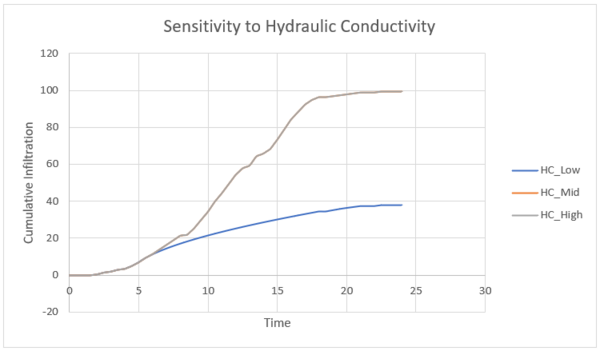
The saturated hydraulic conductivity, measured in mm per hour, represents the ease that water can travel through the soil whilst it is saturated. The saturated hydraulic conductivity is the equivalent of the limiting infiltration rate in the Horton infiltration model. The hydraulic conductivity is high for sandy soils but low for compact clays. Again, the sensitivity was conducted by varying the value for clays, which itself is relatively by low, with three scenarios, low (0.3), mid representing the mean (15.86) and high (117.8). The results shown in figure 5 show that the parameter is very sensitive to the changes in the hydraulic conductivity with the mid and high values providing a lot of infiltration and no runoff at the downstream gauge. The importance of hydraulic conductivity in the calculation of infiltration with the Green Ampt equation has been well documented. As expected, the higher the hydraulic conductivity, then the more infiltration that occurs and the less runoff that is seen at the gauge.
Figure 5: Sensitivity of simulated flow at the Cefn-Brwn gauge location in the Plynlimon Gwy catchment to the Saturated Hydraulic Conductivity parameter in the Green-Ampt infiltration model when using a clay soil type.
Figure 6: Sensitivity of cumulative infiltration in the Plynlimon Gwy catchment to the Saturated Hydraulic Conductivity parameter in the Green-Ampt infiltration model.
Porosity
The porosity value represents the volume of dry voids per volume of soil and provides the maximum moisture deficit that is available, the difference between the moisture content at saturation and at the start of the simulation.
Sandy soils tend to have lower porosities than clay soils, but drain to lower moisture contents between rainfall events because water is not held as strongly in the soil pores. Therefore, values of porosity tend to be higher for sandy soils when compared to clay soils.
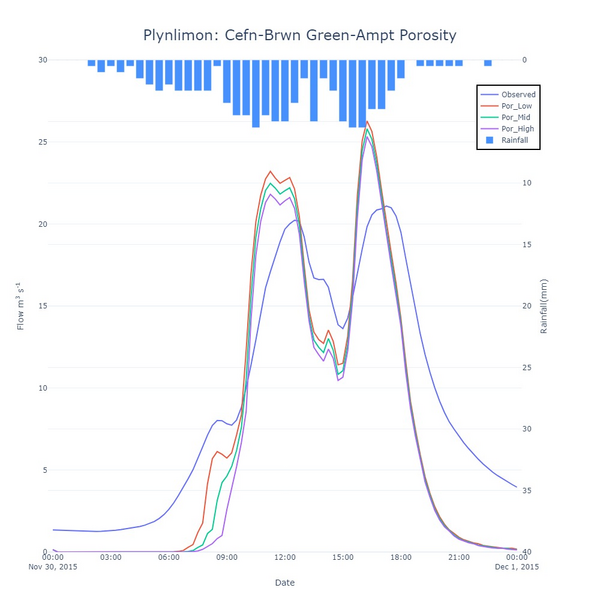
As shown in figure 7, the higher the porosity value, then the less runoff occurs due to increased infiltration although the model is not particular sensitive to the porosity value.
Figure 7: Sensitivity of simulated flow at the Cefn-Brwn gauge location in the Plynlimon Gwy catchment to the porosity parameter in the Green-Ampt infiltration model.
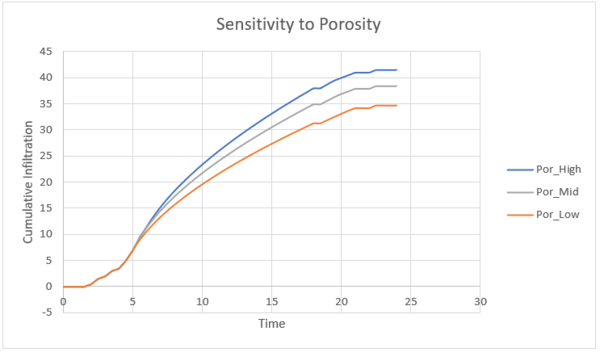
Figure 8: Sensitivity of cumulative infiltration in the Plynlimon Gwy catchment to the porosity parameter in the Green-Ampt infiltration model.
In built USDA soil type
The model was also run with the default in-build USDA soil types. Figure 10 shows the outputs. As expected the higher the soil type, then typically the more the infiltration and the lower the produced runoff. Soils 8-11, which represent sandy soils do not show any runoff in this example as the rainfall is all infiltrated.
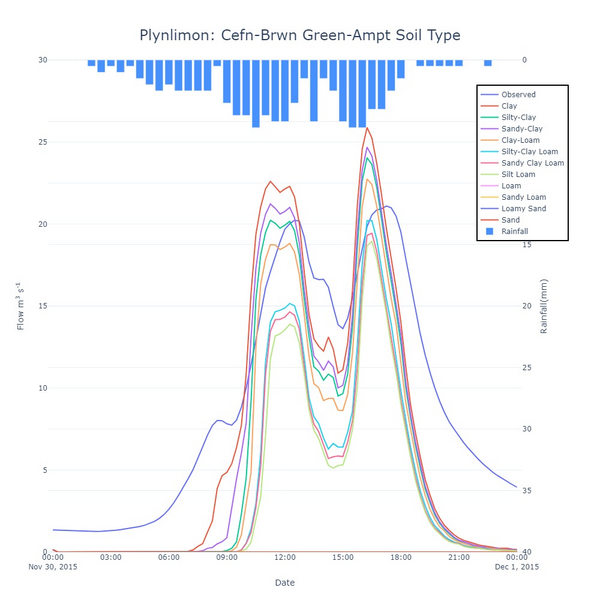
Figure 10: Sensitivity of simulated flow at the Cefn-Brwn gauge locations in the Plynlimon Gwy catchment to the USDA soil type parameter in the Green-Ampt infiltration model.
Summary
The Green-Ampt infiltration model is one of the available infiltration models within TUFLOW. There is a wide range of literature on Green-Ampt applications and some suggested parameter values for particular soil types, albeit soil types from the US. The 3 main Green-Ampt parameters have been tested to show the sensitivity of model outputs to the values as well as the variation in initial moisture. The results show that the model is relatively insensitive to the porosity value and suction head parameter. However, the outputs do show variations in runoff volume due to variations in both hydraulic conductivity and initial soil moisture. As part of any calibration exercise it is suggested that these would be the parameters that are most focused on. The hydraulic conductivity appears to affect the runoff volume throughout the event whereas the initial soil moisture has a limited impact at the beginning of the event before soils become saturated and results converge.
