12D Model
This page under construction and contains material from the 12d Model Roadflow Quickstart and TUFLOW TCF training courses. For the complete course notes or further information, please contact rob.graham@12d.com
Introduction
12d model is a complete civil engineering design software including data terrain modelling, road design, sub division, railway, drainage and much more.
The water water resources modules include the 1d HEC RAS interface, 1d pipe systems (culvert and urban networks) with rational and unsteady flow hydrology and the 2d TUFLOW analysis.
12d model integrates TUFLOW with the file creation, editing and result visualisation.
The section below is an extremely fast method to get a TUFLOW project up and running. For the full featured TUFLOW editors please see = 12d Model TUFLOW Editors=
Basics
Getting Started.. Fast
The Roadflow interface is the quick start method of creating a TUFLOW project. It creates all of the TUFLOW files, launches the TUFLOW engine and reads the results for plan, section and 3d visualisation of results.
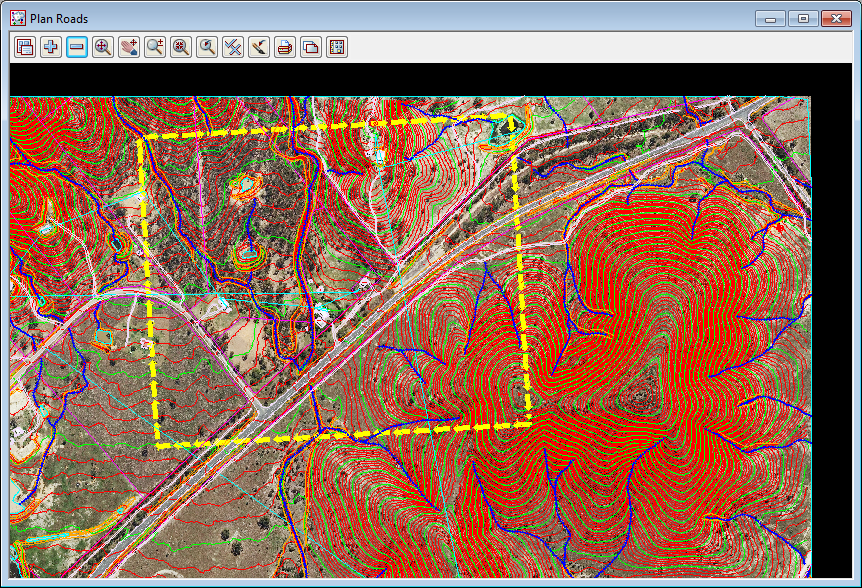
Prior to running this option you need to create a data terrain model (tin or super tin) and draw a rectangle indicating the TUFLOW grid extent. The optional data tab has further options and will be discussed later.
The roadflow panel is found on the menu under Design->TUFLOW->Roadflow. The rectangle is selected using the first field and the tin in entered in the second Ground tin field. The other values are typed entry as desired. Select the Run button to start the TUFLOW run.
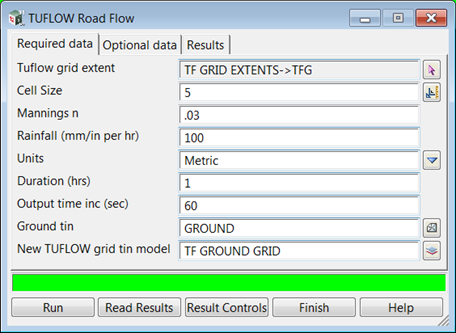
The TUFLOW grid tin model will contain a 12d model grid tin with the centre and side elevations for the TUFLOW run.
While TUFLOW is running the usual data from the "black screen" is captured and displayed as graphed data.
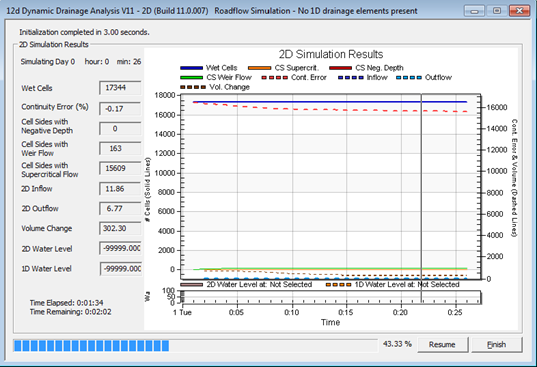
While TUFLOW is solving the results can be monitored and displayed in 12d. This will be discussed later.
When the TUFLOW run is complete, select the Read results button to link 12d to the result files for displaying. You will be instructed to select the tlf file for the run and then once again select the Read results button.
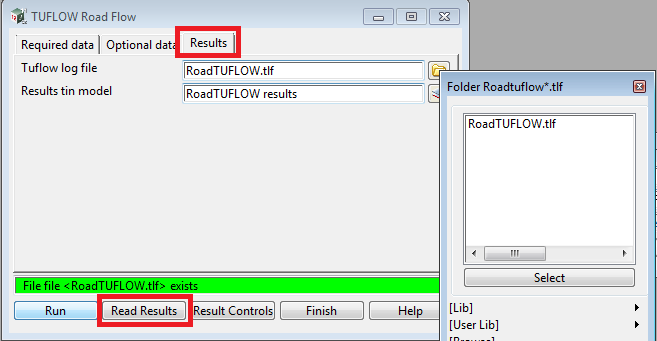
Remember the name of the Results tin model. This is the model you will add onto the views to see your results.
Add the Results tin model onto a 3d OpenGL view. The results tin will be set to display water levels and the perspective views will have the water surface coloured by depth.
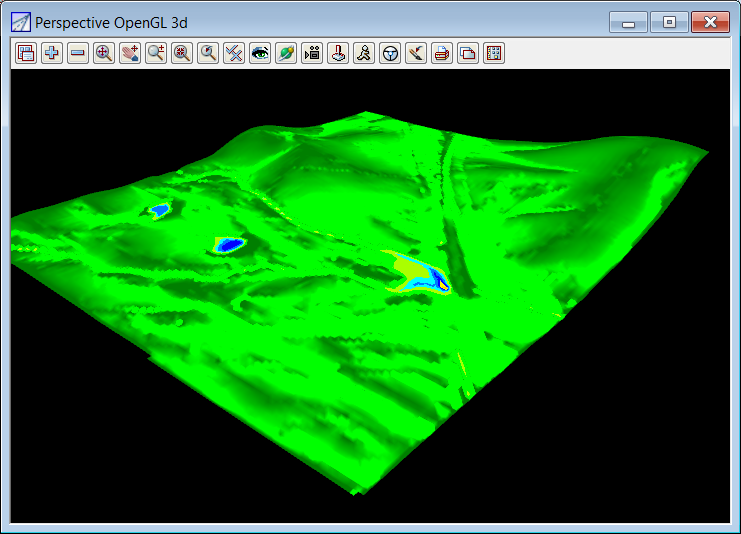
Viewing Depth, Hazard, and Velocity Contours
Select the Results Controls button to change what is displayed via the results grid tin. Change the Tin Inquire Results to Result Velocity Vector. This setting controls the
- contours displayed by the tin,
- the value shown by Tin Inquire Height',
- the level in the section view (yes you can plot velocity profiles across a channel),
- the result plotted in the time graphs,
- and the elevation shown in a 3d perspective view (in this case a 3d velocity map may be generated).
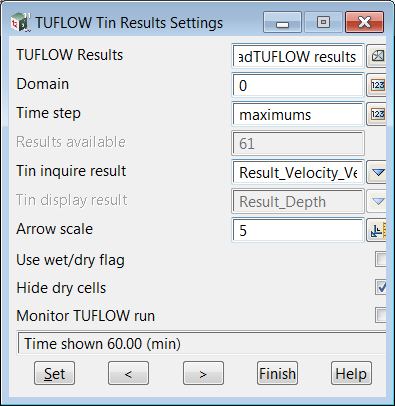
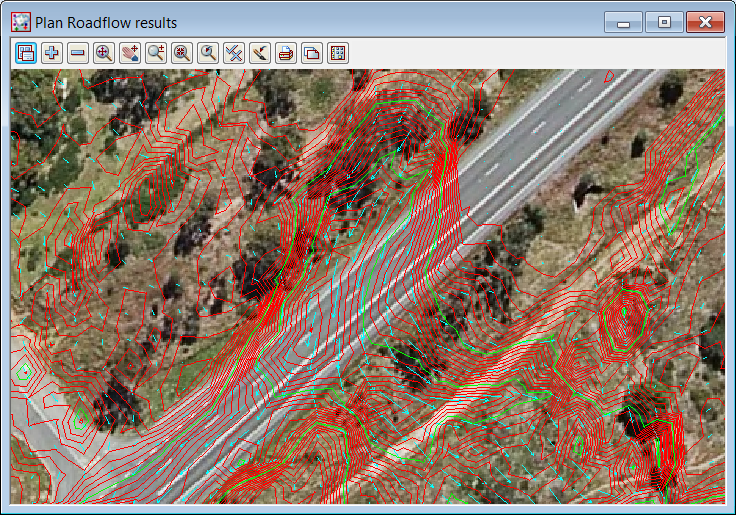
Add the Results tin model (the one you were to remember) onto a plan view and check that the contours are turned on and set as desired (F11 key).
If you also have the raster image added to the view you will see the following. The 1m/s is drawn at the length in the field Arrow Scale. The colour of the arrows is the same colour as the tin (see Tins->Tin manager).
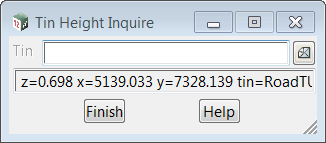
One method of inquiring the contour values is via Tin Inquire Height. No need to select a tin if there is only one tin on the view. Move the pointer to a contour and the velocity is displayed.
Time Series Graphs
To graph the velocity versus time at any location use the Design->TUFLOW->Tuflow results graph.
Select the Results tin model (the one you were to remember) for the TUFLOW results tin, optionally enter a Label and use the pick arrow to select a location on the results grid. (your cursor snap should be on).
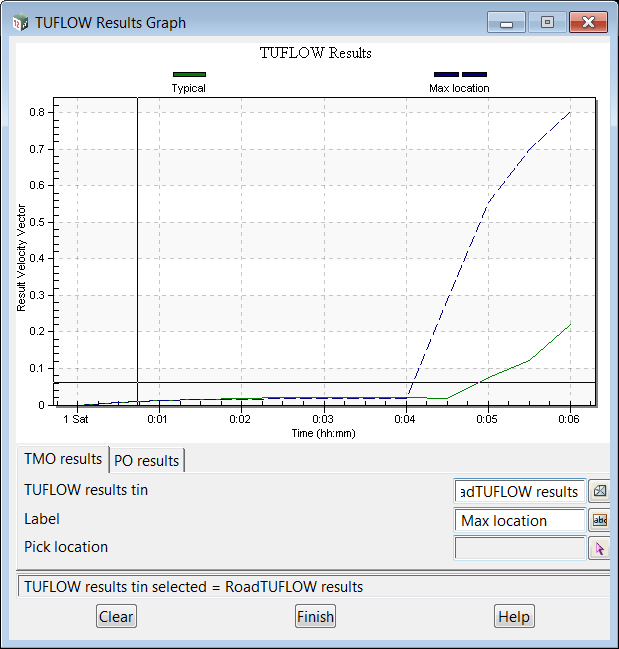
Note that if you leave the Label blank and pick a 12d string instead of a cursor location, the name of the string will be used as the label. Creating a model of graph locations strings is a perfect way to ensure all results are from the some x,y location.
Selecting multiple locations will add additional graphs to the plot. There is a Clear button to start over. Right mouse selecting will produce a menu with Export dialog... for exporting the image for reporting.
Viewing results at Various Times
Recall selecting the Results Controls button above (the same panel can be obtained via the menu Design->TUFLOW->TMO tin settings). The Time step is set to maximums when the results are read. The < and > arrows can be used to move to the previous and next time step. Alternatively, enter a time step in the Time step field and select Set. The modelling time will be displayed in the message area of the panel. If you enter a number greater than or equal to the Results available the maximum values at each cell centre will be displayed. The TUFLOW tmo format produces results at the cell centres.
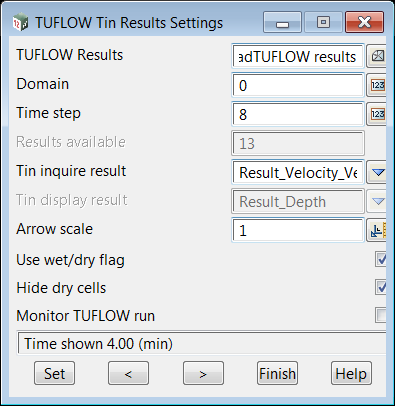
Referring back to the 3d view, the results are displayed for all of the cells, wet or dry. To show hide the dry cells select BOTH the Use wet/dry flag' and Hide dry cells. The Use wet/dry flag alone will change the colour of the tin solid to green (dry) or blue (wet).
TCF Editor
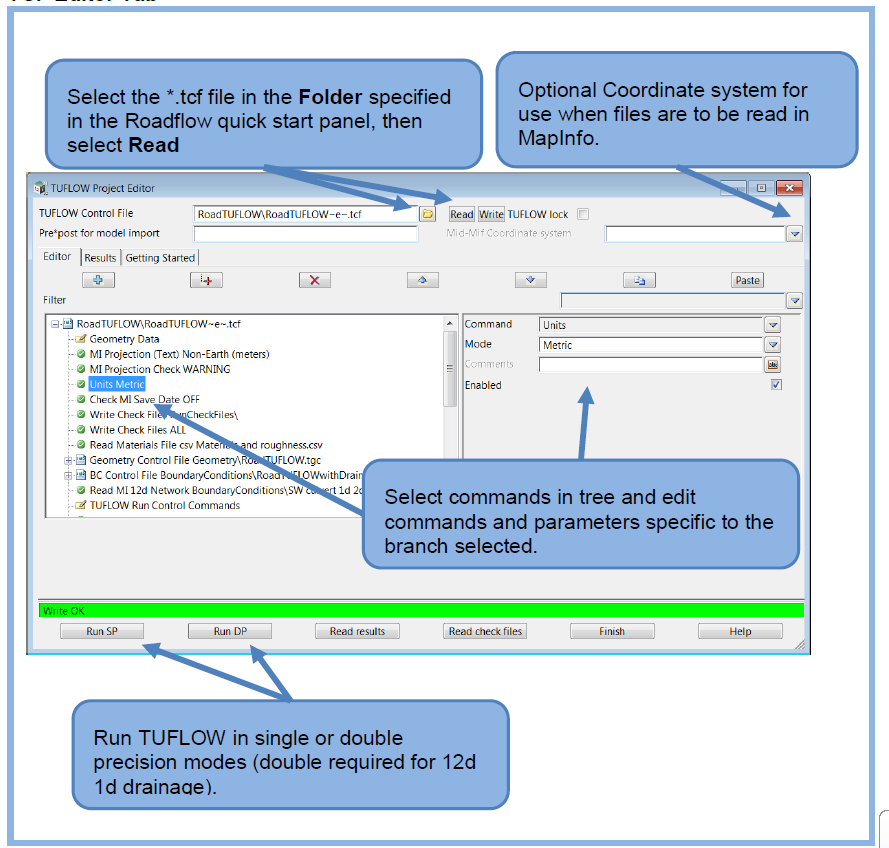
The Roadflow panel is the fastest 12d model tool for getting started with a TUFLOW project. Although powerful it does not give you access to all the TUFLOW commands. for this you will want to use the TCF editor.
The 12d model built in TCF editor does much more than edit the TUFLOW commands, arguments via a user defined interface. This interface:
- edits the tcf, tgf and tbf
- runs TUFLOW
- reads check files
- steps through error messages
Reading a TCF file
Relax: You can switch between your text editor and the 12d editor any time. When the tcf panel reads your tcf file it records the white space (tabs and blank lines). When you write(save) the file, it maintains your formatting. Always save the file in one editor before reading it in the other!
Note the + button beside the Geometry Control file and BC Control File branches. Expand these branches to see the full contents of theses files.
-==The Power of the Folder Icon==- The folder icon is displayed beside all of the fields where files are to be selected. Use this icon to
- Select the file (always the first step)
- Open will open the file in your editor (text editor, Excel etc.)
- Start windows explorer
Read Check Files
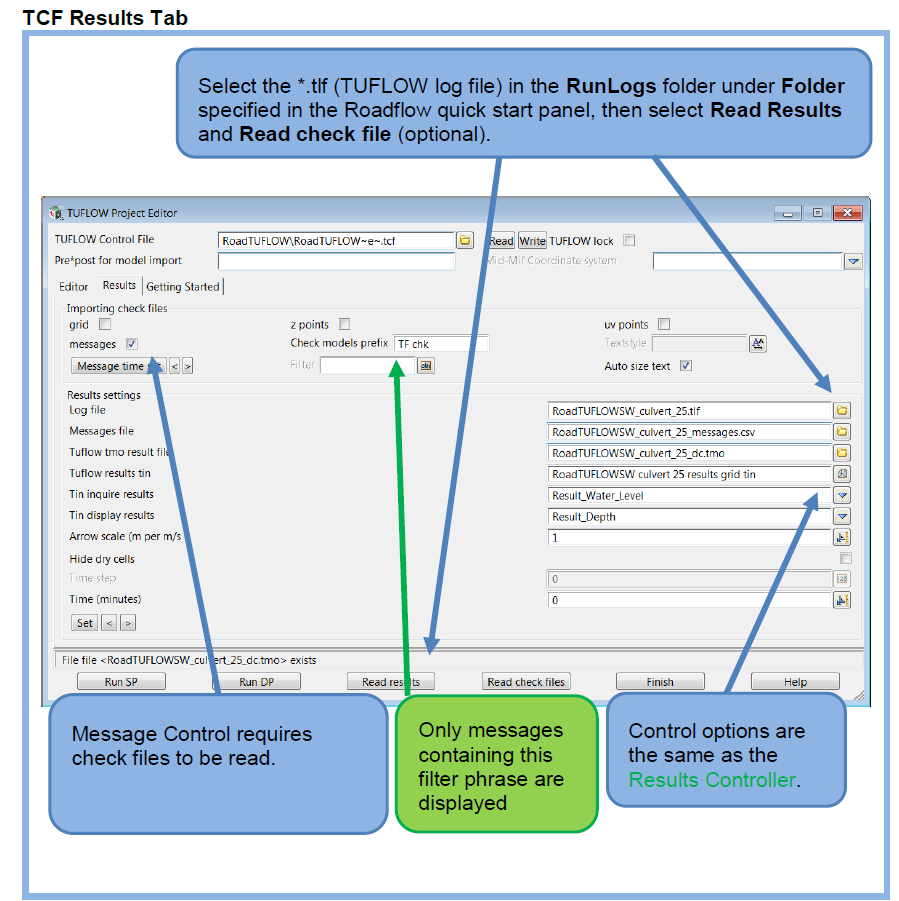
TUFLOW check or log files are crucial to understanding your TUFLOW model. The Results tab gives you access to your log file check file settings.
Read Check files reads almost all of the check files except the ones the optional ones listed.
The Check model prefix will be the model prefix for all of the check files read. For example the file RoadTUFLOW_zsh_zpt_check" will be read into the model TF chk RoadTUFLOW zsh zpt check
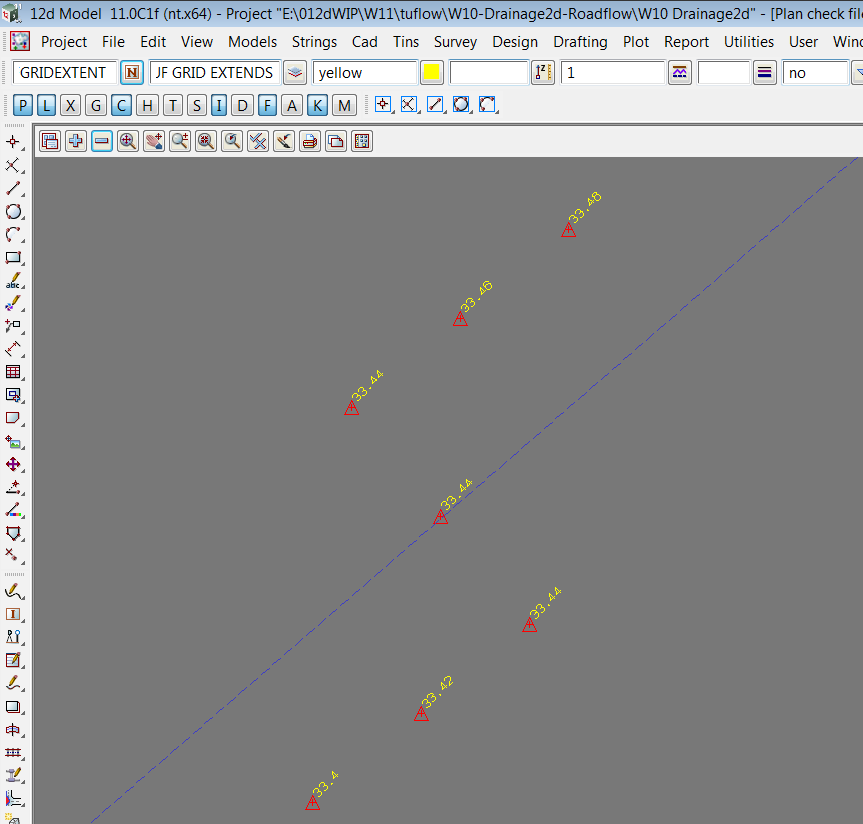
Zsh Zpts Check file
After reading in the check files add the model TF chk RoadTUFLOW zsh zpt check on to a plan view to see the following.
The upward pointing triangle indicate that the TUFLOW z value has been raised to the elevation shown in yellow (view Z values toggles on). The blue line is the original ridge lines. Gully lines would have the triangle pointing down.
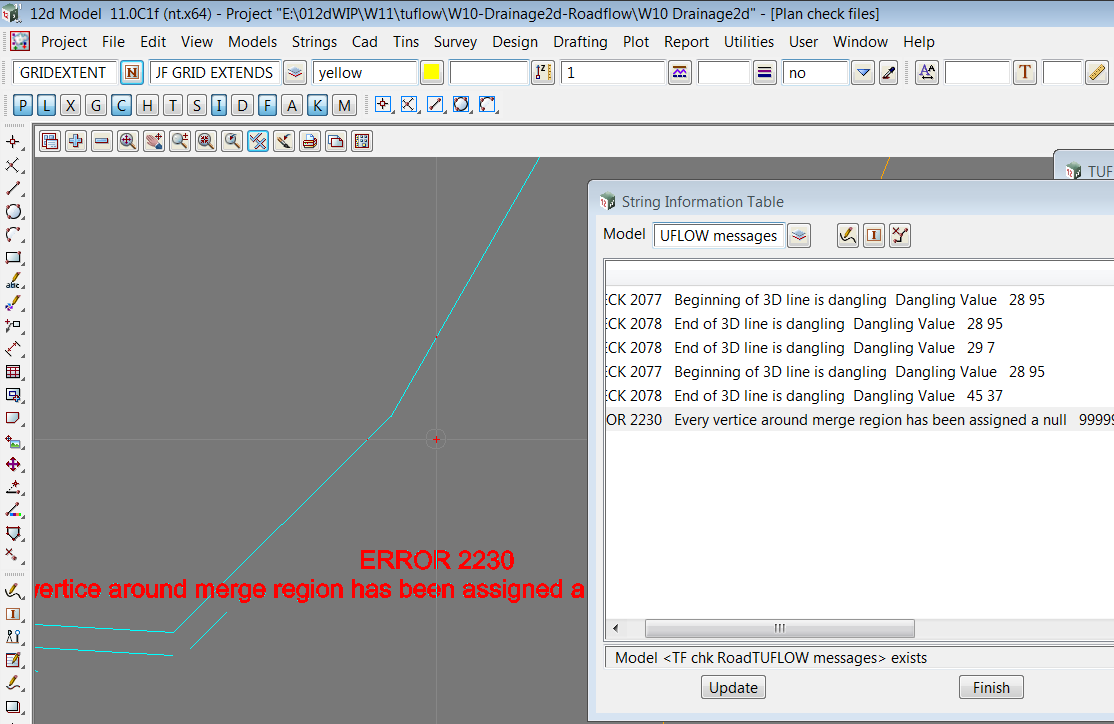
Messages Check File
The model TF chk RoadTUFLOW messages will contain all of the TUFLOW messages with x,y locations. From the 12d model menu select.
Models->Model Info Table. The error messages will appear in the same order as generated from TUFLOW. Select the desired message and the 12d model plan views will have a large cross hair indicating the x,y location and the message will be displayed (even if the messages model is not added to the view). Of course adding the model to the plan view will allow you to see many of the messages.
Messages Controller and filter
Sometimes showing all of the messages at once can be a bit overwhelming. The Filter field will only show the messages containing the phrase entered. Entering Error would only show the error messages and exclude the warning.
The messages with a time stamp are not shown all at once. The < and > next to Message time set step to the next time step a message is found. This is extremely helpful for tracking the origins and patterns of instability messages. For each cell, the message for the current time is displayed at the cell centre, the next message at this location is displayed below and the previous message is displayed above. Seeing the previous, current and future messages for a cell all at once gives the user a chance to identify time trends in the messages.
String Attribute Editors
12d model super strings are used for the TUFLOW modellings. The CAD tools on the toolbar are used for drawing and editing while the CAD control bar (usually at the top of the screen) controls the properties such as colour, linestyle etc..
12d model string and point heights are automatically converted to attributes as required when the data is written to mid/mif file.
There are 3 usual choices for editting attributes in 12d model:
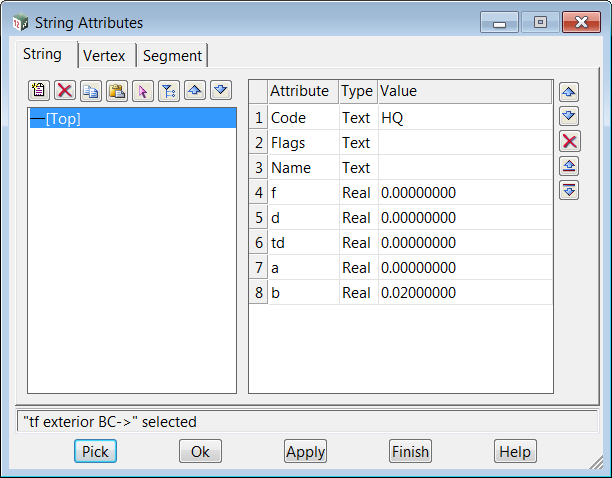
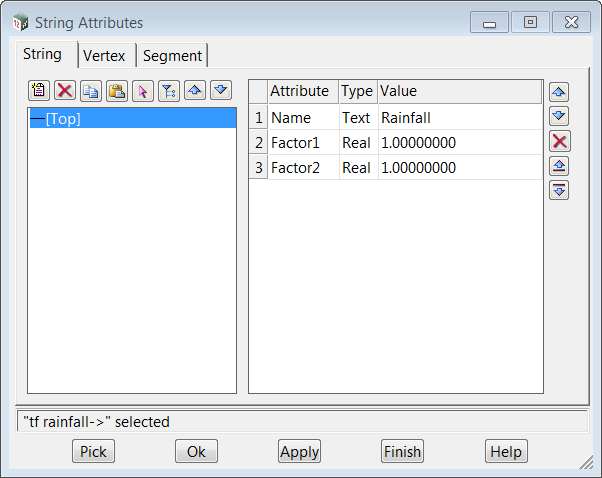
- Strings->Properties->Attributes The most flexibly editor for all cases. Example attributes for a HQ boundary condition are shown below.
- File->User->String Attributes Properties to-from clipboard For editing attributes via copy and paste to a spreadsheet.
- Design->TUFLOW->TUFLOW string editor The most powerful for common TUFLOW strings
String Attribute Editor
String Attributes to-from Clipboard
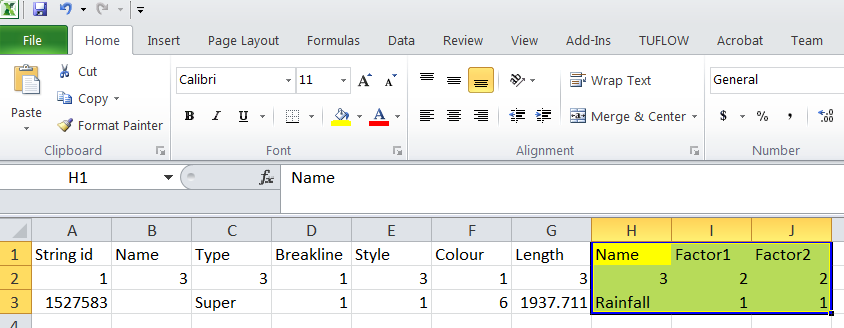
Select the model and then copy to place all of the attributes on the Windows clipboard so that they may be pasted into a spreadsheet. After changing the spreadsheet, all of the data may be copied back onto the clipboard and then use the paste button to update 12d model.
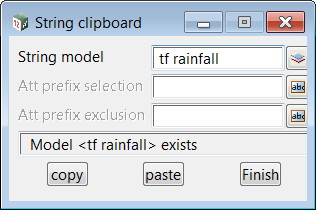 >>
>>
The cells highlighted in yellow are relevant columns for TUFLOW.
 >>
>>
TSE TUFLOW String Editor
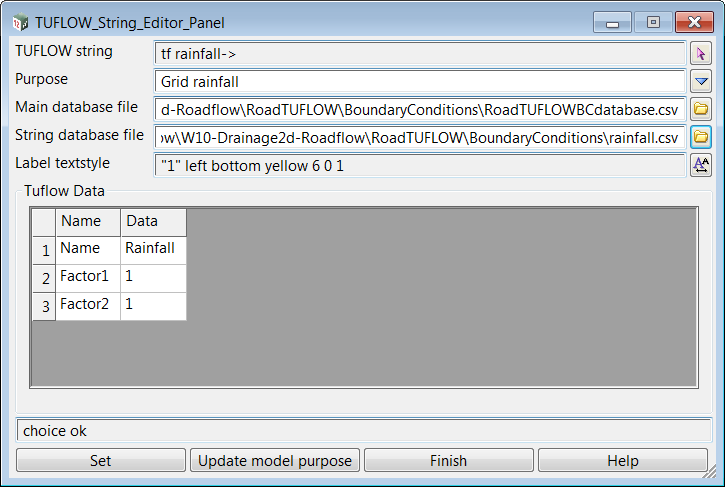
The TUFLOW string editor give the most guidance and additional functionality for the common TUFLOW strings. The additional features are
- the Purpose sets the default attribute type for all of the strings in the model. You do not need to set the type of attribute. The type is pre determined.
- Main database file optional direct access to a csv file (usually boundary condition or materials/soils file). This value is shared by all strings in the model.
- String database file optional direct access to a csv file related to the string. This value is unique to this string and in this case the csv file that contains the rainfall data is selected.
- when Purpose is set to Materials the regions are coloured and labelled with data from the materials file.
Extra Material Files Information
12d model look for 2 extra columns in the materials csv file for a type description and colour. This are used to label and colour the material regions. Ensure that yo have selected a materials string and the Main database file is set to the materials csv file. Selecting Set will label and fill ALL the strings in the same model as the selected string.

