Difference between revisions of "TUFLOW Viewer - Map Outputs - Curtain Plot"
Ellis Symons (talk | contribs) |
Ellis Symons (talk | contribs) |
||
| Line 17: | Line 17: | ||
<li> Right click to finish drawing your line (note: line must contain at least 2 vertices and right clicking does not add a vertex) | <li> Right click to finish drawing your line (note: line must contain at least 2 vertices and right clicking does not add a vertex) | ||
</ol> | </ol> | ||
| − | + | <br> | |
It can also be useful to turn on the Vertical Mesh when using the curtain plot. See the relevant link at the bottom of this page for information on the vertical mesh.<br> | It can also be useful to turn on the Vertical Mesh when using the curtain plot. See the relevant link at the bottom of this page for information on the vertical mesh.<br> | ||
Revision as of 01:33, 20 April 2021

Tool Description
Similar to the cross-section plotting tool, it extracts section results along a polyline from the map outputs. The plot will represent a given result type along the line using a colour ramp. However, unlike the cross-section plot, the curtain plot will include results from all vertical layers. For TUFLOW Classic/HPC models, there will only be one vertical layer, however for 3D outputs from TUFLOW FV, it will extract results down the vertical profile as well as along the section line.
The tool will plot data from the current timestep, or maximum data if the result type has maximum toggled on. Vector results can also be displayed in the curtain plot and will be displayed as vector arrows. Vector direction displayed in the curtain plot is relative the drawn section line. For example, if flow is travelling perpendicular to the drawn line, the vectors in the curtain plot will have no length (or be very small).
It is recommended that users should only plot one result type at a time with curtain plots except when plotting a scalar result with a vector result.
To use the tool:
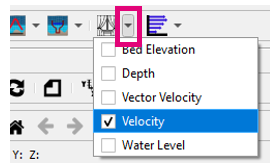
- Select which result type to plot using the down arrow next to the curtain plot icon in the toolbar
- Click off the drop down menu somewhere in a blank section of the TUFLOW Viewer toolbar
- Click the curtain plot icon so that it becomes indented and the cursor changes to a crosshair
- Left click in the QGIS map window to start drawing a line. Left click to add vertices to the polyline.
- Right click to finish drawing your line (note: line must contain at least 2 vertices and right clicking does not add a vertex)

It can also be useful to turn on the Vertical Mesh when using the curtain plot. See the relevant link at the bottom of this page for information on the vertical mesh.
Examples
Example 1: Curtain plot of velocity from a 2D TUFLOW HPC model

Example 2: Curtain plot of velocity from a 2D TUFLOW HPC model with vectors

Example 3: Curtain plot of salinity from a 3D TUFLOW FV model
