TUFLOW Viewer - Map Outputs - Curtain Plot
Tool Description
Similar to the cross-section plotting tool, this tool extracts section results along a polyline from the map outputs. The plot will represent a given result type along the line using a colour ramp. However, unlike the cross-section plot, the curtain plot will include results from all vertical layers. For TUFLOW Classic/HPC models, there will only be one vertical layer, however for 3D outputs from TUFLOW FV, it will extract results down the vertical profile as well as along the section line.
The tool will plot data from the current timestep, or maximum data if the result type has maximum toggled on. Vector results can also be displayed in the curtain plot and will be displayed as vector arrows. Vector direction displayed in the curtain plot is relative to the drawn section line. For example, if flow is travelling perpendicular to the drawn line, the vectors in the curtain plot will have no length (or be very small).
Since version 3.1.0, TUFLOW Viewer will calculate mesh intersections with the plotting line and use mid-way points to extract mesh information. This was done to improve extraction from flexible mesh results (e.g. Quadtree and FV).
Note: some mesh results store information on the mesh face as opposed to the mesh vertices (mesh face in this context refers to the cell area as opposed to the mesh sides) and TUFLOW Viewer will use the raw mesh face results and not the resampled vertex information. An example of a result dataset that stores results on the mesh face is TUFLOW FV NetCDF map outputs. Users can view the intersection points (and faces if applicable) by toggling on Mesh Intercept Locations in Settings >> Options >> Check / Debug. Prior to version 3.1.0, TUFLOW Viewer used a sampling distance which can be set in the options.
Since version 3.6, TUFLOW Viewer will automatically include 'vertical velocity' ('W' output) in the curtain vectors if this output is found in the results. See Example 4 below.
It is recommended that users should only plot one result type at a time with curtain plots, except when plotting a scalar result with a vector result.
To use the tool:
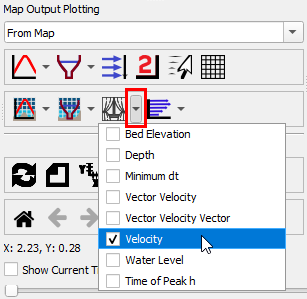
- Select which result type to plot using the down arrow next to the curtain plot icon in the toolbar.
- Click off the drop down menu somewhere in a blank section of the TUFLOW Viewer toolbar.
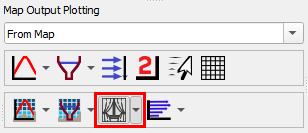
- Click the curtain plot icon so that it becomes indented and the cursor changes to a crosshair.
- Left click in the QGIS map window to start drawing a line. Left click to add vertices to the polyline.
- Right click to finish drawing your line (note: line must contain at least 2 vertices and right clicking does not add a vertex).


It can also be useful to turn on the Vertical Mesh when using the curtain plot. This can be toggled on using the plot right-click context menu.
Examples
Example 1: Curtain plot of velocity from a 2D TUFLOW HPC model
Example 2: Curtain plot of velocity from a 2D TUFLOW HPC model with vectors
Example 3: Curtain plot of salinity from a 3D TUFLOW FV model

Example 4: Curtain plot with vertical velocity vectors

| Up |
|---|