Difference between revisions of "TUFLOW Viewer - Map Outputs - Plotting From Vector Layer"
Jump to navigation
Jump to search
Ellis Symons (talk | contribs) (Created page with "===Tool Descriptioin=== ===Examples=== ===Links=== ====Similar Tools==== * Load Results * TUFLOW_Viewer_-_Load_Results_-_Map_Outputs | Loa...") |
Ellis Symons (talk | contribs) |
||
| Line 1: | Line 1: | ||
===Tool Descriptioin=== | ===Tool Descriptioin=== | ||
| + | To plot from a vector layer, change '''From Map''' to '''Layer Selection'''in the dropdown box above the map plotting icons.<br> | ||
| + | [[File: Plotting_From_Layer_Selection.PNG]]<br> | ||
| + | |||
| + | To initiate plot: | ||
| + | <ol> | ||
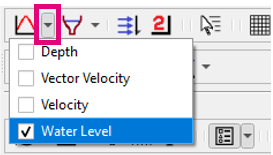
| + | <li> Select which result type to plot using the down arrow next to the desired plotting type icon in the toolbar<br> | ||
| + | [[File: Plotting_Toolbar_TimeSeries_Dropdown.PNG ]] | ||
| + | <li> Select features in a vector layer (supported geometries: points, polylines) | ||
| + | <li> Click the desired plotting type icon to plot | ||
| + | </ol> | ||
| + | |||
===Examples=== | ===Examples=== | ||
===Links=== | ===Links=== | ||
Revision as of 20:48, 7 April 2021
Tool Descriptioin
To plot from a vector layer, change From Map to Layer Selectionin the dropdown box above the map plotting icons.

To initiate plot:
- Select which result type to plot using the down arrow next to the desired plotting type icon in the toolbar
- Select features in a vector layer (supported geometries: points, polylines)
- Click the desired plotting type icon to plot
