TUFLOW Viewer - Map Outputs - Plotting From Vector Layer
Tool Description
To plot from a vector layer, change From Map to Layer Selection in the dropdown box above the map plotting icons.

To initiate the plot:
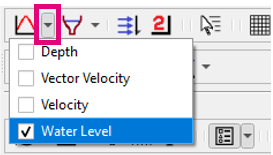
- Select which result type to plot using the down arrow next to the desired plotting type icon in the toolbar (e.g. time series).
- Select features in a vector layer (supported geometries: points, polylines).
- Click the desired plotting type icon to plot.

Depending on the plotting type, certain geometry types are expected. For example, for time series plotting, point geometries are expected. For cross-section plotting, polyline geometry is expected.
When plotting from a vector layer, the item is given a label in the plot legend based on the feature attributes. The index of which attribute to use can be changed via Settings >> Options under Map Plotting -> Label Field Index. Setting this value to a number that is greater than the number of attributes the layer has will turn this labelling method off and it will revert to similar labelling rules as From Map.

Example

| Up |
|---|