Difference between revisions of "TUFLOW Viewer - Map Outputs - Plotting Time Series"
Jump to navigation
Jump to search
Ellis Symons (talk | contribs) |
Ellis Symons (talk | contribs) |
||
| Line 1: | Line 1: | ||
| + | [[File: Plotting_Toolbar_TimeSeries.PNG ]]<br><Br> | ||
| + | __TOC__ | ||
===Tool Description=== | ===Tool Description=== | ||
| + | Extracts time series results from a point from the map outputs. Users can choose one or multiple results to plot at once. For 3D map outputs, the tool will use the curren 3D to 2D depth average rendering method.<br> | ||
| + | |||
| + | To use the tool: | ||
| + | <ol> | ||
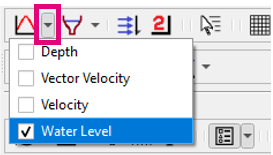
| + | <li> Select which result type to plot using the down arrow next to the time series icon in the toolbar<br> | ||
| + | [[File: Plotting_Toolbar_TimeSeries_Dropdown.PNG ]] | ||
| + | <li> Click off the drop down menu somewhere in a blank section of the TUFLOW Viewer toolbar | ||
| + | <li> Select a location on the map outputs to plot from | ||
| + | </ol> | ||
===Examples=== | ===Examples=== | ||
===Links=== | ===Links=== | ||
Revision as of 23:55, 1 March 2021

Tool Description
Extracts time series results from a point from the map outputs. Users can choose one or multiple results to plot at once. For 3D map outputs, the tool will use the curren 3D to 2D depth average rendering method.
To use the tool:
- Select which result type to plot using the down arrow next to the time series icon in the toolbar
- Click off the drop down menu somewhere in a blank section of the TUFLOW Viewer toolbar
- Select a location on the map outputs to plot from
