Difference between revisions of "TUFLOW Viewer - Plotting 1D Flow Regime"
Jump to navigation
Jump to search
Ellis Symons (talk | contribs) |
Chris Huxley (talk | contribs) |
||
| (6 intermediate revisions by 3 users not shown) | |||
| Line 2: | Line 2: | ||
Flow regime can be a very useful output to understand and debug 1D results, in particular, culverts.<br> | Flow regime can be a very useful output to understand and debug 1D results, in particular, culverts.<br> | ||
| − | Flow regime results are output from ESTRY by default i.e. there is no special output type or command required in the ECF. Since the 2020-01-AA TUFLOW release, flow regime results will be imported into TUFLOW Viewer when time series results are loaded. There are several methods to view the flow regime results: | + | Flow regime results are output from ESTRY by default (i.e. there is no special output type or command required in the ECF). Since the 2020-01-AA TUFLOW release, flow regime results will be imported into TUFLOW Viewer when time series results are loaded. There are several methods to view the flow regime results: |
<ol> | <ol> | ||
| − | <li>Select 'Flow Regime' in the '''Result Type''' widget (underneath 'Time Series')<br> | + | <li>Select 'Flow Regime' in the '''Result Type''' widget (underneath 'Time Series').<br> |
[[File: Plotting_TimeSeries_FlowRegime.PNG]]<br><br> | [[File: Plotting_TimeSeries_FlowRegime.PNG]]<br><br> | ||
This will display the flow regime as points and lock the y-axis to the available flow regime types as per the TUFLOW Manual. The plot will group the types by outlet and inlet control regimes - 'G' is no flow, everything below 'G' on the plot will be inlet control and everything above 'G' is outlet control.<Br> | This will display the flow regime as points and lock the y-axis to the available flow regime types as per the TUFLOW Manual. The plot will group the types by outlet and inlet control regimes - 'G' is no flow, everything below 'G' on the plot will be inlet control and everything above 'G' is outlet control.<Br> | ||
[[File: Plotting_TimeSeries_FlowRegime_Example.PNG]]<br><Br> | [[File: Plotting_TimeSeries_FlowRegime_Example.PNG]]<br><Br> | ||
| − | <li>Right clicking certain time series results [[File:results_2.png | 15px]] (e.g. 'Flow', 'Level', or 'Velocity') will give the user the option of checking on '''Flow Regime'''<br> | + | <li>Right clicking certain time series results [[File:results_2.png | 15px]] (e.g. 'Flow', 'Level', or 'Velocity') will give the user the option of checking on '''Flow Regime'''.<br> |
[[File: Plotting_TimeSeries_FlowRegime_ContextMenu.PNG]]<br><br> | [[File: Plotting_TimeSeries_FlowRegime_ContextMenu.PNG]]<br><br> | ||
| Line 16: | Line 16: | ||
</ol> | </ol> | ||
| − | '''Flow Regimes ( | + | '''Flow Regimes (Source: TUFLOW Manual)'''<br><br> |
[[File:Plotting_TimeSeries_FlowRegime_Legend.PNG]]<br> | [[File:Plotting_TimeSeries_FlowRegime_Legend.PNG]]<br> | ||
| − | === | + | ===Example=== |
[[File: Plotting_TimeSeries_FlowRegime_Example.gif]] | [[File: Plotting_TimeSeries_FlowRegime_Example.gif]] | ||
| − | + | <br><br> | |
| − | |||
| − | |||
| − | |||
| − | |||
| − | = | + | {{Tips Navigation |
| − | + | |uplink=[[TUFLOW_Viewer#Time_Series_Output| Back to TUFLOW Viewer Main Page]] | |
| + | }} | ||
Latest revision as of 14:47, 2 June 2021
Tool Description
Flow regime can be a very useful output to understand and debug 1D results, in particular, culverts.
Flow regime results are output from ESTRY by default (i.e. there is no special output type or command required in the ECF). Since the 2020-01-AA TUFLOW release, flow regime results will be imported into TUFLOW Viewer when time series results are loaded. There are several methods to view the flow regime results:
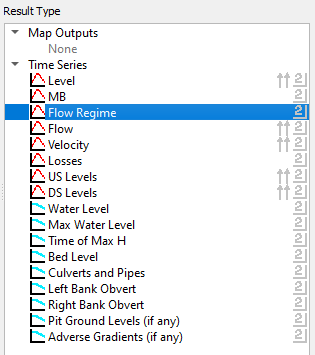
- Select 'Flow Regime' in the Result Type widget (underneath 'Time Series').
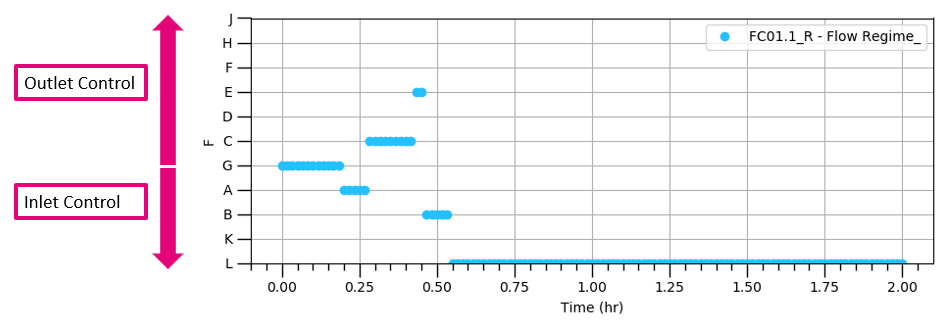
This will display the flow regime as points and lock the y-axis to the available flow regime types as per the TUFLOW Manual. The plot will group the types by outlet and inlet control regimes - 'G' is no flow, everything below 'G' on the plot will be inlet control and everything above 'G' is outlet control.
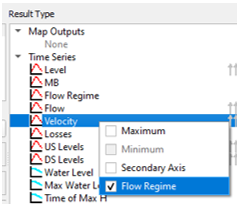
- Right clicking certain time series results
 (e.g. 'Flow', 'Level', or 'Velocity') will give the user the option of checking on Flow Regime.
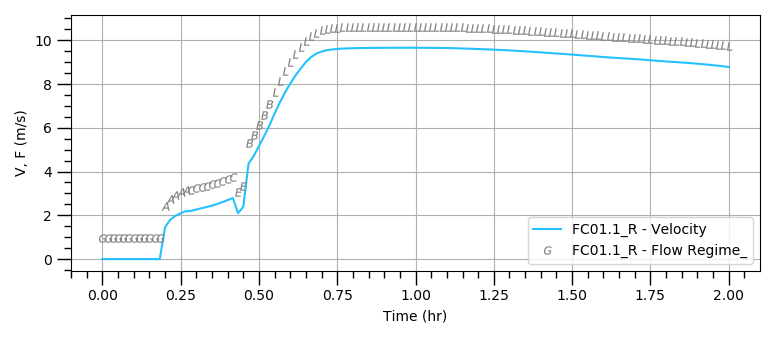
This will plot the flow regime as letters and map it to the chosen result type, making visualising the result a lot easier. For example, in the image below the small jump in velocity at approximately 0.4 hrs is shown to be a change in flow regime (it goes from 'C' to 'E' then to 'B'.


Flow Regimes (Source: TUFLOW Manual)

Example

| Up |
|---|