Difference between revisions of "TUFLOW Viewer - Time Series Outputs - Plotting 1D Cross-Section Inputs"
Jump to navigation
Jump to search
Chris Huxley (talk | contribs) |
Ellis Symons (talk | contribs) |
||
| (One intermediate revision by the same user not shown) | |||
| Line 10: | Line 10: | ||
This process is identical whether viewing ESTRY cross-section inputs or Flood Modeller cross-sections.<Br> | This process is identical whether viewing ESTRY cross-section inputs or Flood Modeller cross-sections.<Br> | ||
| + | |||
| + | ''Since v3.4:''<Br> | ||
| + | The option to show/hide inactive areas of an ESTRY cross-section is available via ''Settings >> Options >> Plotting >> Plot inactive areas in 1D cross-section''.<Br> | ||
===Example=== | ===Example=== | ||
Latest revision as of 23:10, 30 May 2022
Tool Description
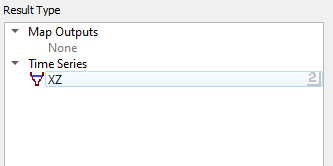
Cross-section inputs can be viewed in TUFLOW Viewer by:
- Select a result type from the Time Series section - available cross-section types will have a cross-section icon
 to the left
- Select a cross-section from the input layer
- If results are loaded -
 Water Level time series result type can be selected to display results on the cross section. The results are temporal and will change with time (maximum results may also be available)

This process is identical whether viewing ESTRY cross-section inputs or Flood Modeller cross-sections.
Since v3.4:
The option to show/hide inactive areas of an ESTRY cross-section is available via Settings >> Options >> Plotting >> Plot inactive areas in 1D cross-section.
Example

| Up |
|---|