Difference between revisions of "TUFLOW Viewer - Time Series Outputs - Plotting Time Series"
Jump to navigation
Jump to search
Ellis Symons (talk | contribs) |
Ellis Symons (talk | contribs) |
||
| Line 20: | Line 20: | ||
====Similar Tools==== | ====Similar Tools==== | ||
* [[TUFLOW_Viewer_-_Load_Results | Load Results]] | * [[TUFLOW_Viewer_-_Load_Results | Load Results]] | ||
| − | * [[TUFLOW_Viewer_-_Load_Results_- | + | * [[TUFLOW_Viewer_-_Load_Results_-_Time_Series | Load Results - Time Series]] |
| − | * [[ | + | * [[TUFLOW_Viewer_-_Load_Results_-_Time_Series_FM | Load Results - Time Series FM]] |
| + | * [[TUFLOW_Viewer_-_Time_Series_Outputs_-_Plotting_Time_Series | Time Series Output - Plotting Time Series]] | ||
| + | * [[TUFLOW_Viewer_-_Time_Series_Outputs_-_Plotting_Longitudinal_Profiles | Time Series Output - Plotting Longitudinal Profiles]] | ||
| + | * [[TUFLOW_Viewer_-_Showing_Selected_Elements_And_Selecting_Sub-Sets | Showing Selected Elements and Selecting Sub-Sets]] | ||
| + | * [[TUFLOW_Viewer_-_Time_Series_Outputs_-_Plotting_1D_Cross-Section_Inputs | Plotting 1D Cross-Section Inputs (with / without results)]] | ||
| + | * [[TUFLOW_Viewer_-_Time_Series_Outputs_-_Plotting_1D_Hydraulic_Table_Check_Files | Plotting 1D Hydraulic Table Check Files]] | ||
| + | * [[TUFLOW_Viewer_-_Using_A_Secondary_Axis | Using a Secondary Axis]]''' | ||
| + | * [[TUFLOW_Viewer_-_Using_A_Date_Axis | Using a Date Axis]]''' | ||
| + | * [[TUFLOW_Viewer_-_Showing_The_Current_Time | Showing the Current Time]]''' | ||
====Back to TUFLOW Viewer Page==== | ====Back to TUFLOW Viewer Page==== | ||
| − | * [[TUFLOW_Viewer# | + | * [[TUFLOW_Viewer#Plotting_Results | Back to TUFLOW Viewer Main Page]] |
Revision as of 00:14, 21 April 2021
Tool Description
Time series results can be either 1D results or 2D PO / RL results and the process of plotting from them are identical.
The below steps outline how to plot a time series graph from time series outpupts:
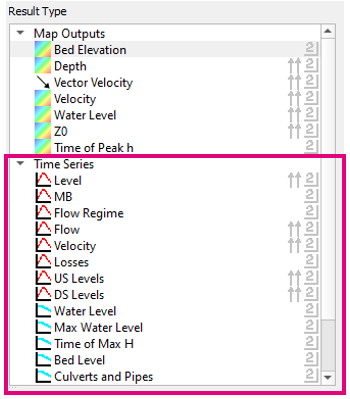
- Select a result type from the Time Series section - available time series result types will have a time series icon
 to the left
- Select a feature in one of the _PLOT_ GIS layers
- The time series will be plotted in the Time Series plotting tab

Selecting features from the appropriate geometry type should be used depending on the result type. For example, to plot 1D flow, a feature from the _PLOT_L (line type) should be selected (for ESTRY results).
To plot multiple result types, simply select multiple types in the Result Type panel.
Examples

Links
Similar Tools
- Load Results
- Load Results - Time Series
- Load Results - Time Series FM
- Time Series Output - Plotting Time Series
- Time Series Output - Plotting Longitudinal Profiles
- Showing Selected Elements and Selecting Sub-Sets
- Plotting 1D Cross-Section Inputs (with / without results)
- Plotting 1D Hydraulic Table Check Files
- Using a Secondary Axis
- Using a Date Axis
- Showing the Current Time