Tutorial M09 Results QGIS
Revision as of 21:07, 13 July 2023 by ElizaCollison (talk | contribs) (→TUFLOW Project Re-Configuration)
Introduction
QGIS is used to load and view a range of event magnitudes and durations with the TUFLOW Viewer. For viewing of the 2D map results, see Module 1.
TUFLOW Project Re-Configuration
Method
Inspect the results for all events:
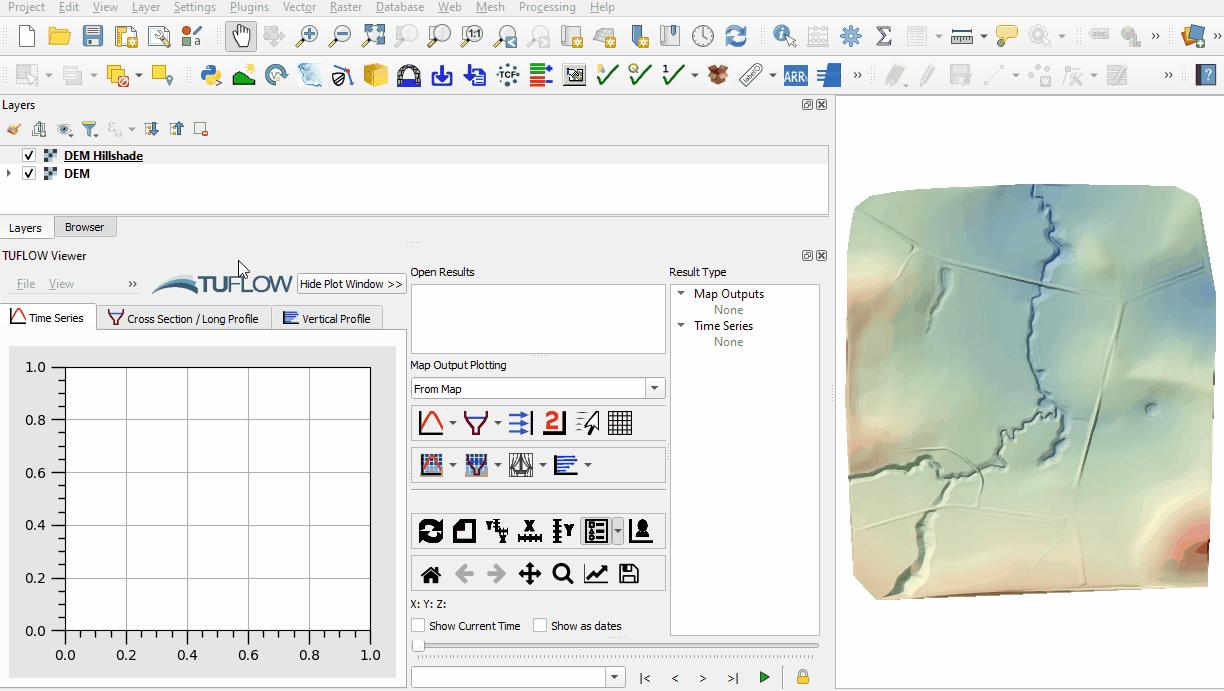
- Open the TUFLOW Viewer.
- Load the results using the TCF. From File > Load Results, navigate to the Module_09\TUFLOW\runs folder and select the following file:
- M09_5m_~e1~_~e2~_001.tcf
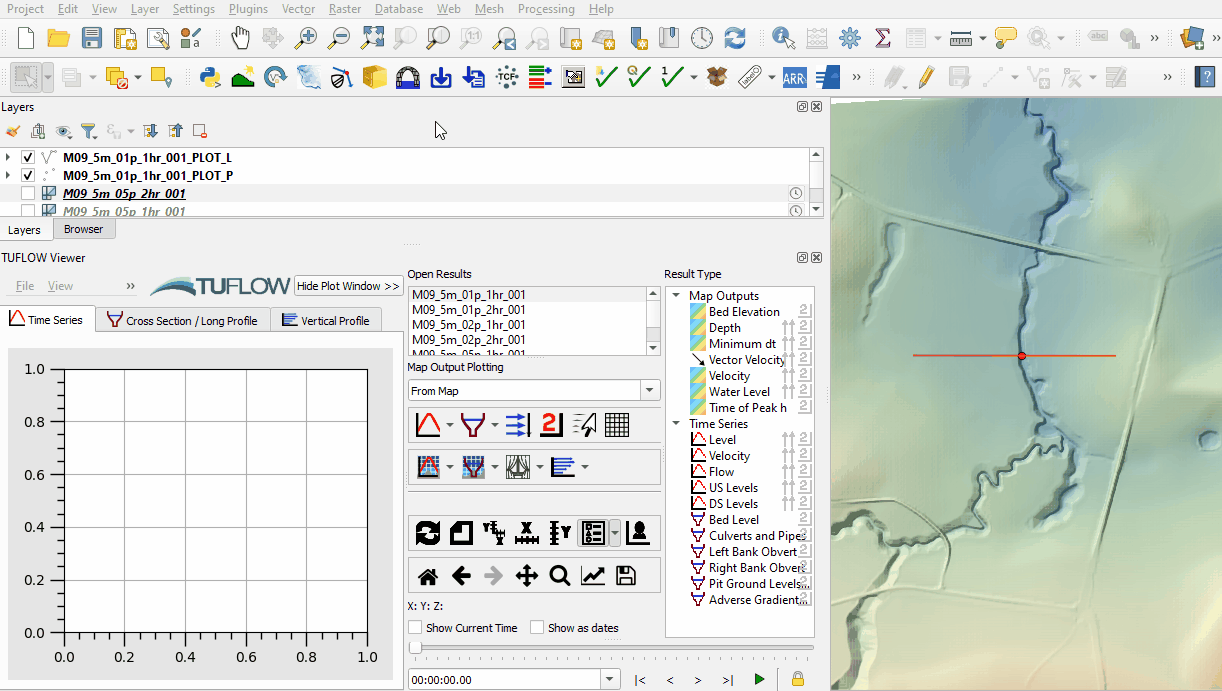
- When prompted, click 'Select All' and 'Ok'. The TUFLOW Viewer opens all six simulation runs using event management:
- Inspect the extent, water level and the flow plot output for each event:


Conclusion
- The results of all event magnitudes and durations were inspected using the TUFLOW Viewer.
- For further functionality, see TUFLOW Viewer.
| Up |
|---|