QGIS SCS to TUFLOW
Introduction
This page presents a recommended method for the application of the U.S. Soil Conservation Service (SCS) (now known as the Natural Resources Conservation Service, part of the U.S. Department of Agriculture) rainfall-runoff model. It is based largely on Technical Release No. 55 (TR55) prepared by the U.S. Soil Conservation Service (SCS, 1986).
Available models
The tool is available for catchments in the Auckland Region1.
Auckland Region
The model is recommended for use in stormwater management design in the Auckland Region. It is designed as a standard tool that provides consistent results from different users. Key features of the stormwater runoff model are:
- Design 24 hour rainfall depths are provided in the form of rainfall maps covering the Auckland Region.
- A standard 24 hour temporal rainfall pattern, having peak rainfall intensity at mid duration. Shorter duration rainfall bursts with a range of durations from 10 minutes to 24 hours are nested within the 24 hour temporal pattern.
- Runoff depth is calculated using SCS rainfall-runoff curves, with curve numbers determined from the SCS guidelines according to classifications assigned to Auckland soil types.
Creating runoff within SCS for use with TUFLOW
The SCS to TUFLOW tool is part of the TUFLOW plugin. The instructions on the page can be followed to install the plugin.
Tool location
To use the SCS to TUFLOW tool, locate the SCS icon on the TUFLOW toolbar.

Alternatively, open the TUFLOW plugin menu and scroll down to ‘Extract SCS for TUFLOW (Beta)’. The tool is nominally in beta mode and we encourage feedback from external users, any comments or suggestions to be sent to support@tuflow.com.

Once the ‘Extract SCS for TUFLOW (beta)’ tool is selected, the SCS to TUFLOW Dialog appears.
Model Selection
Currently, Auckland Region (TP108) is made available as the catchment location. This setup comes with curve number for impervious areas of 98, initial abstraction of 5mm for pervious areas and 0mm for impervious areas.

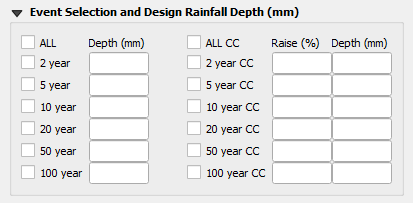
Event Selection and Design Rainfall Depth
At least one event or one climate change (CC) event needs to be selected and have specified design rainfall depth for the tool to run. All events can be specified at once.

Simulation Settings
The input interval, output interval and number of decimal spaces set the parameters for the resulting catchment inflows.

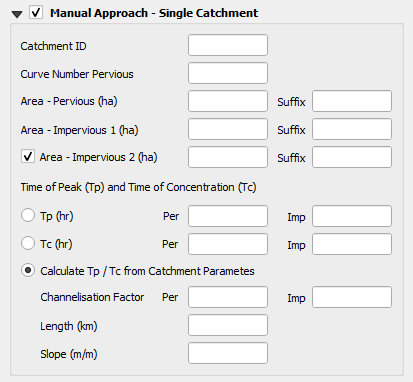
Manual Approach
The manual approach is great for single catchment calculations. It requires one pervious and one impervious catchment component to be specified (either of which can be entered as zero if not present) and one additional impervious component if this is required. The suffix will get appended to the catchment ID and used in the final inflow csv and bc_dbase. Every suffix must be unique. Either time of peak or time of concentration can be specified directly. Alternatively, catchment parameters can be used for their calculation.

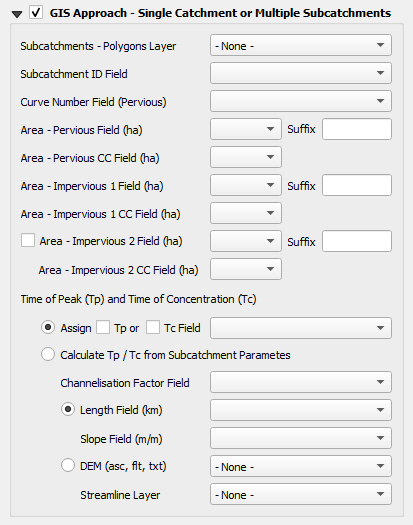
GIS Approach
The GIS approach allows a GIS layer to be used as a source of catchment parameters and as such a catchment with multiple subcatchments can be processed in once. The subcatchment layer name is to be selected in the first drop down menu. Attributes from the layer will then become available to select as the catchment parameters in a similar way as for the manual approach. In addition, time of peak and time of concentration can also be calculated from a DEM and a streamline layer.

Output location
Specify output location where inflows for every event in csv format, bc_dbase and TUFLOW event file are to be saved. The tool also saves input_log text file that can be used as a check of input parameters. This file isn't being read into TUFLOW.

Running the tool
Once all above is set, hit the "Run" button in the bottom right corner. If there are any missing/incorrect information, the tool will prompt to fill/correct these before continuing. When all input data are filled correctly, the progress bar gets active and "Processing Data Into TUFLOW Format . . ." note appears in the bottom left corner. Once all hydrographs and other outputs are processed the note changes to "Finished Successfully".
Summary
This page provides instructions of how to use the SCS to TUFLOW tool within the QGIS TUFLOW plugin to obtain inflow inputs for use within TUFLOW model. This requires the input of design rainfall depths for selected events and catchment parameters. Apart from the inflow inputs the tool also creates boundary database and event file that can be read directly into TUFLOW.
If you encounter any issues with the tool please email support@tuflow.com.
References
1Auckland Regional Council, April 1999, TP108. Guidelines for stormwater runoff modelling in the Auckland Region.
| Up |
|---|