Tutorial M10 001 GIS Inputs QGIS
Jump to navigation
Jump to search
Introduction
QGIS is used to create, import and view input data.
TUFLOW Project Re-Configuration
Re-configure the TUFLOW project to use and save empty files to the correct folder:
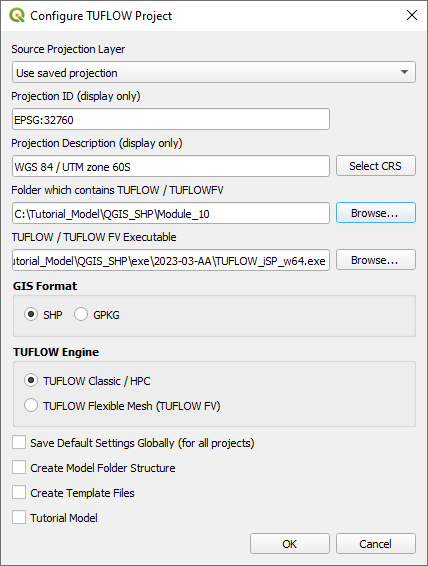
- Go to Plugins > TUFLOW > Editing > Configure / Create TUFLOW Project.
- Change the folder which contains TUFLOW to the Module_10 folder. This is the only change required, the model folder structure and template empty files are supplied from previous model.
Note: The 'results' and 'check' folder get automatically created when the TUFLOW model is run.
- Click 'OK' and save the QGIS workspace by selecting Project > Save As.
- Set the QGIS workspace projection to EPSG:32760, see Set the Projection.

Method
Navigate to the Module_10\Tutorial_Data folder. Copy the below GIS files into the Module_10\TUFLOW\model\gis folder:
- 2d_zsh_M10_damwall_001_L
- 2d_vzsh_M10_dambreak_001_R
- 2d_iwl_M10_001_R
- 2d_sa_M10_inflow_001_R
Investigate the supplied files:
- Open the files, either:
- Drag and drop all .shp files into the QGIS workspace, or
- Select Layer > Add layer > Add Vector Layer and navigate to the Module_10\TUFLOW\model\gis folder.
- The 2d_zsh line layer represents the dam wall:
- A ‘Z’ attribute of 65 is specified, the elevations are set to 65 metres along the length of the line.
- The line has the same Shape_Width as the cell size, this is a thick breakline modifying whole cells.
- The 2d_vzsh polygon layer represents the location of the dam break:
- Shape_Width_or_dMax set to less than zero indicates that the vertices along the perimeter of the polygon are used to interpolate elevations.
- Trigger_Value sets the simulation time in hours that the dam break is to commence. A value of 1 indicates the dam break begins at 1 hour.
- Period sets the time in hours over which the change in elevation occurs. A value of 0.25 sets a period of 15 minutes replicating the break.
- The 2d_iwl polygon layer represents the initial water level of the dam as 59m at all cells within the polygon.
- The 2d_sa layer replaces the 2d_bc QT type introduced in Module 1. A 2d_sa inflow is typically more stable in situations of fast model changes, for example, dam breaks.
- Select the 2d_sa_M10_inflow_001_R in the Layers panel and use the 'Apply TUFLOW Styles to Current Layer' tool.
Increment the 2d_bc layer from Module 01 and remove the upstream inflow:
- Navigate to the Module_10\model\gis folder and open the 2d_bc_M01_001_L.shp in QGIS.
- Select the 2d_bc_M01_001_L layer in the Layers panel.
- Use the 'Apply TUFLOW Styles to Current Layer' tool.
- Click on the ‘Increment Selected Layer’ symbol from the TUFLOW Plugin toolbar.
- Update the 'Output Layer Name' to 2d_bc_M10_001_L.shp.
- Click 'OK'.
- The tool removes the source layer from the Layers panel and the 2d_bc_M10_001_L appears.
- Right click on the 2d_bc_M10_001_L layer to toggle on Editing.
- Zoom to the upstream inflow, select and delete the line.
- Click 'OK' and turn off editing to save the edits.
Conclusion
- A 2d_zsh layer was checked to enforce a dam wall in the model.
- A 2d_vzsh layer was inspected to simulate a break in the dam wall.
- A 2d_iwl layer was reviewed setting the initial water level within the dam upstream of the dam wall.
- The original upstream inflow was removed from the model, replaced by a source area boundary.
| Up |
|---|