Tutorial M01 Results QGIS: Difference between revisions
Jump to navigation
Jump to search
Content deleted Content added
| Line 8: | Line 8: | ||
View grid results with Profile Tool:<br> |
View grid results with Profile Tool:<br> |
||
<ol> |
<ol> |
||
<li>Load the '''M01_5m_001_h_Max.tif''' file from the '''Module_01\TUFLOW\results\ |
<li>Load the '''M01_5m_001_h_Max.tif''' file from the '''Module_01\TUFLOW\results\grid''' folder. It can either be dragged and dropped into QGIS, or loaded by selecting Layer > Add Layer > Add Raster Layer from the menu. |
||
<li>This displays the maximum water level in the model recorded during the whole simulation. |
<li>This displays the maximum water level in the model recorded during the whole simulation. |
||
<li>Use the Profile Tool to view the maximum water level and DEM.<br> |
<li>Use the Profile Tool to view the maximum water level and DEM.<br> |
||
Revision as of 00:13, 1 June 2023
Introduction
QGIS is used to view the grid and mesh 2D results:
- The grid results (.tif) are inspected with the Profile Tool plugin. For installation, see Installation of Profile Tool
- The mesh results (.xmdf) are inspected with the TUFLOW Viewer which is part of the TUFLOW plugin. For installation, see Installation of TUFLOW Plugin.
Method
View grid results with Profile Tool:
- Load the M01_5m_001_h_Max.tif file from the Module_01\TUFLOW\results\grid folder. It can either be dragged and dropped into QGIS, or loaded by selecting Layer > Add Layer > Add Raster Layer from the menu.
- This displays the maximum water level in the model recorded during the whole simulation.
- Use the Profile Tool to view the maximum water level and DEM.

View mesh results (Map Outputs) with TUFLOW Viewer:
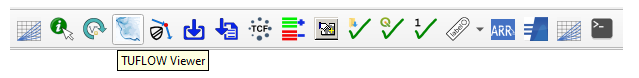
- Open the TUFLOW Viewer from the TUFLOW plugin toolbar:
- Load the results using the TCF. From File > Load Results, navigate to the Module_01\TUFLOW\runs folder and select the M01_5m_001.tcf file. This option uses the file paths within the TCF to load both types of results, Map Outputs and Time Series.
Note: The same File > Load Results option can be used when loading from the M01_5m_001.tlf file written in the Module_01\TUFLOW\runs\log folder.
- Alternatively, open the Map Outputs and Time Series results independently using:
- Load Results - Map Outputs > select map output mesh results file (.xmdf)
- Load Results - Time Series > select time series output results (.tpc)
- The Map Outputs show scalar datasets, e.g. depth and velocity, and vector datasets, e.g. velocity vectors. Only one scalar and one vector dataset can be displayed at the same time.
- Select M01_5m_001 from the Open Results list, click on a scalar dataset 'Depth' under the Result Type and scroll through the output times. The results update as new output times are selected. Note: The styling of the Map Outputs can be changed by right clicking on each result dataset and editing the 'Properties'.
- Click on a vector dataset 'Vector Velocity' to add it to the displayed 'Depth' and visualise them together. The vector output shows both direction and magnitude.
Note: The appearance of vectors can be be changed. Right click on 'Vector Velocity' and edit the 'Properties'.


View mesh results (Time Series) with TUFLOW Viewer from the 2d_po files:
- Using the 'Select Features' tool, select the M01_5m_001_PLOT_L line, and select the Flow dataset from the Time Series Result Type. This shows the flow data across the 2d_po line (Type Q_).
- View the point time series for Level and Velocity dataset (Type H_ and V_) by selecting the M01_5m_001_PLOT_P in the Layers panel and the point.

Conclusion
- The basics of viewing 2D TUFLOW results in QGIS using the TUFLOW Viewer were covered.
- For further functionality, see TUFLOW Viewer.
| Up |
|---|