Tutorial M01 Results QGIS update V2 draft
Introduction
QGIS is used to view the grid and mesh 2D results:
- The grid results (.tif) are inspected with the Profile Tool plugin. For installation, see Installation of Profile Tool
- The mesh results (.xmdf) are inspected with the TUFLOW Viewer which is part of the TUFLOW plugin. For installation, see Installation of TUFLOW Plugin.
Method using TUFLOW Viewer 2
View grid results with Profile Tool:
- Load the M01_5m_001_h_Max.tif file from the Module_01\TUFLOW\results\grids folder. It can either be dragged and dropped into QGIS, or loaded by selecting Layer > Add Layer > Add Raster Layer from the menu.
- This displays the maximum water level in the model recorded during the whole simulation.
- Use the Profile Tool to view the maximum water level and DEM.
View mesh results (Map Outputs) with TUFLOW Viewer:
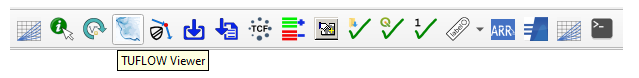
- Open the TUFLOW Viewer from the TUFLOW plugin toolbar:
- Load the results using the TCF. From File > Load Results, navigate to the Module_01\TUFLOW\runs folder and select the M01_5m_001.tcf file. This option uses the file paths within the TCF to load both types of results, Map Outputs and Time Series.
Note: The same File > Load Results option can be used when loading from the M01_5m_001.tlf file written in the Module_01\TUFLOW\runs\log folder.
- Alternatively, open the Map Outputs and Time Series results independently using:
- Load Results - Map Outputs > select map output mesh results file (.xmdf)
- Load Results - Time Series > select time series output results (.tpc)
- The Map Outputs show scalar datasets, e.g. depth and velocity, and vector datasets, e.g. velocity vectors. Only one scalar and one vector dataset can be displayed at the same time.
- Select M01_5m_001 from the Open Results list, click on a scalar dataset 'Depth' under the Result Type and scroll through the output times. The results update as new output times are selected. Note: The styling of the Map Outputs can be changed by right clicking on each result dataset and editing the 'Properties'.
- Click on a vector dataset 'Vector Velocity' to add it to the displayed 'Depth' and visualise them together. The vector output shows both direction and magnitude.
Note: The appearance of vectors can be be changed. Right click on 'Vector Velocity' and edit the 'Properties'.

View mesh results (Time Series) with TUFLOW Viewer from the 2d_po files:
- Using the 'Select Features' tool, select the M01_5m_001_PLOT_L line, and select the Flow dataset from the Time Series Result Type. This shows the flow data across the 2d_po line (Type Q_).
- View the point time series for Level and Velocity dataset (Type H_ and V_) by selecting the M01_5m_001_PLOT_P in the Layers panel and the point.
Conclusion
- The basics of viewing 2D TUFLOW results in QGIS using the TUFLOW Viewer were covered.
- For further functionality, see TUFLOW Viewer.
| Up |
|---|