Difference between revisions of "TUFLOW Viewer - Extracting Median And Mean Time Series"
Jump to navigation
Jump to search
Ellis Symons (talk | contribs) |
Ellis Symons (talk | contribs) |
||
| Line 20: | Line 20: | ||
* [[TUFLOW_Viewer_-_Map_Outputs_-_Plotting_Flow | Map Output - Plotting Flow]] | * [[TUFLOW_Viewer_-_Map_Outputs_-_Plotting_Flow | Map Output - Plotting Flow]] | ||
* [[TUFLOW_Viewer_-_Map_Outputs_-_Plotting_From_Vector_Layer | Map Output - Plotting From Vector a Layer (e.g. shp file)]] | * [[TUFLOW_Viewer_-_Map_Outputs_-_Plotting_From_Vector_Layer | Map Output - Plotting From Vector a Layer (e.g. shp file)]] | ||
| + | * [[TUFLOW_Viewer_-_Time_Series_Outputs_-_Plotting_Time_Series | Time Series Output - Plotting Time Series]] | ||
* [[TUFLOW_Viewer_-_Customising_The_Plot_Legend | Customising The Legend]] | * [[TUFLOW_Viewer_-_Customising_The_Plot_Legend | Customising The Legend]] | ||
* [[TUFLOW_Viewer_-_Customising_The_Plotting_Styles | Customising The Plotting Styles]] | * [[TUFLOW_Viewer_-_Customising_The_Plotting_Styles | Customising The Plotting Styles]] | ||
| Line 25: | Line 26: | ||
====Back to TUFLOW Viewer Page==== | ====Back to TUFLOW Viewer Page==== | ||
| − | * [[TUFLOW_Viewer# | + | * [[TUFLOW_Viewer#Plotting_Results | Back to TUFLOW Viewer Main Page]] |
Revision as of 00:44, 21 April 2021
Tool Description
TUFLOW Viewer offers the ability to pull out the median and / or mean time series from the plot window. The tool will extract the chosen statistic from all plotted results, so the user should ensure they only have one element selected and all of (and only) the relevant events selected in the Open Results widget (i.e. for ARR only one AEP/duration combination and all 10 temporal patterns).
- Results >> ARR2019
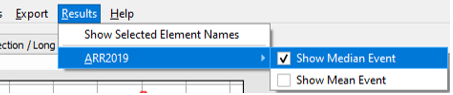
- Toggle on one, or both of, Show Median Event and Show Mean Event
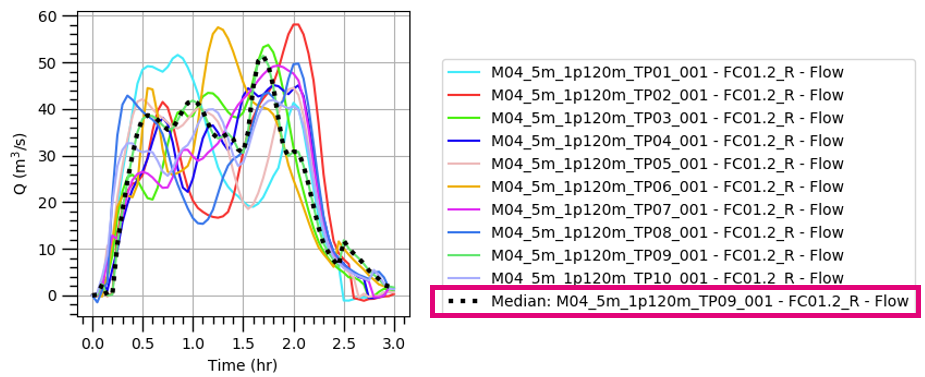
- The time series plot should automatically update to show the resulting events.
- The source of the resulting event(s) will be labelled in the plot legend


The mean event selection always chooses an actual event and by default selects the next higher. This can be changed to closest in Settings >> Options >> Plotting and setting Mean Event Selection to 'closest'.

Examples

Links
Similar Tools
- Map Output - Plotting Time Series
- Map Output - Plotting Flow
- Map Output - Plotting From Vector a Layer (e.g. shp file)
- Time Series Output - Plotting Time Series
- Customising The Legend
- Customising The Plotting Styles
- Customising The Plot Axes