Difference between revisions of "TUFLOW Viewer - Map Outputs - Styling Scalar Types"
Jump to navigation
Jump to search
Chris Huxley (talk | contribs) |
|||
| (One intermediate revision by the same user not shown) | |||
| Line 15: | Line 15: | ||
[[File: MapOutputs_StyleScalarType.gif]] | [[File: MapOutputs_StyleScalarType.gif]] | ||
<br><br> | <br><br> | ||
| − | + | '''Related Links''' | |
| + | *[[TUFLOW_Viewer_-_Map_Outputs_-_Change_Result_Selection | Change Simulation Result Selection]] | ||
| + | *[[TUFLOW_Viewer_-_Map_Outputs_-_Changing_Result_Type | Change Result Type Selection]] | ||
| + | *[[TUFLOW_Viewer_-_Map_Outputs_-_Displaying_Maximum | Display Result Maximum]] | ||
| + | *[[TUFLOW_Viewer_-_Map_Outputs_-_Displaying_Vectors | Display Vectors]] | ||
| + | *[[TUFLOW_Viewer_-_Map_Outputs_-_Styling_Vector_Types | Style Vector Map Outputs]] | ||
| + | *[[TUFLOW_Viewer_-_Map_Outputs_-_Saving_Default_Styles | Save Default Styles]] | ||
| + | *[[TUFLOW_Viewer_-_Map_Outputs_-_Displaying_The_Mesh | Display The Mesh]] | ||
| + | *[[TUFLOW_Viewer_-_Map_Outputs_-_3D_to_2D_Depth_Averaging_Method | 3D to 2D Depth Averaging]] | ||
| + | *[[TUFLOW_Viewer_-_Toggling_Between_Output_Timesteps | Toggling Between Output Timesteps]] | ||
| + | <br> | ||
{{Tips Navigation | {{Tips Navigation | ||
| − | |uplink=[[TUFLOW_Viewer# | + | |uplink=[[TUFLOW_Viewer#Map_Output| Back to TUFLOW Viewer Main Page]] |
}} | }} | ||
Latest revision as of 14:50, 2 June 2021
Tool Description
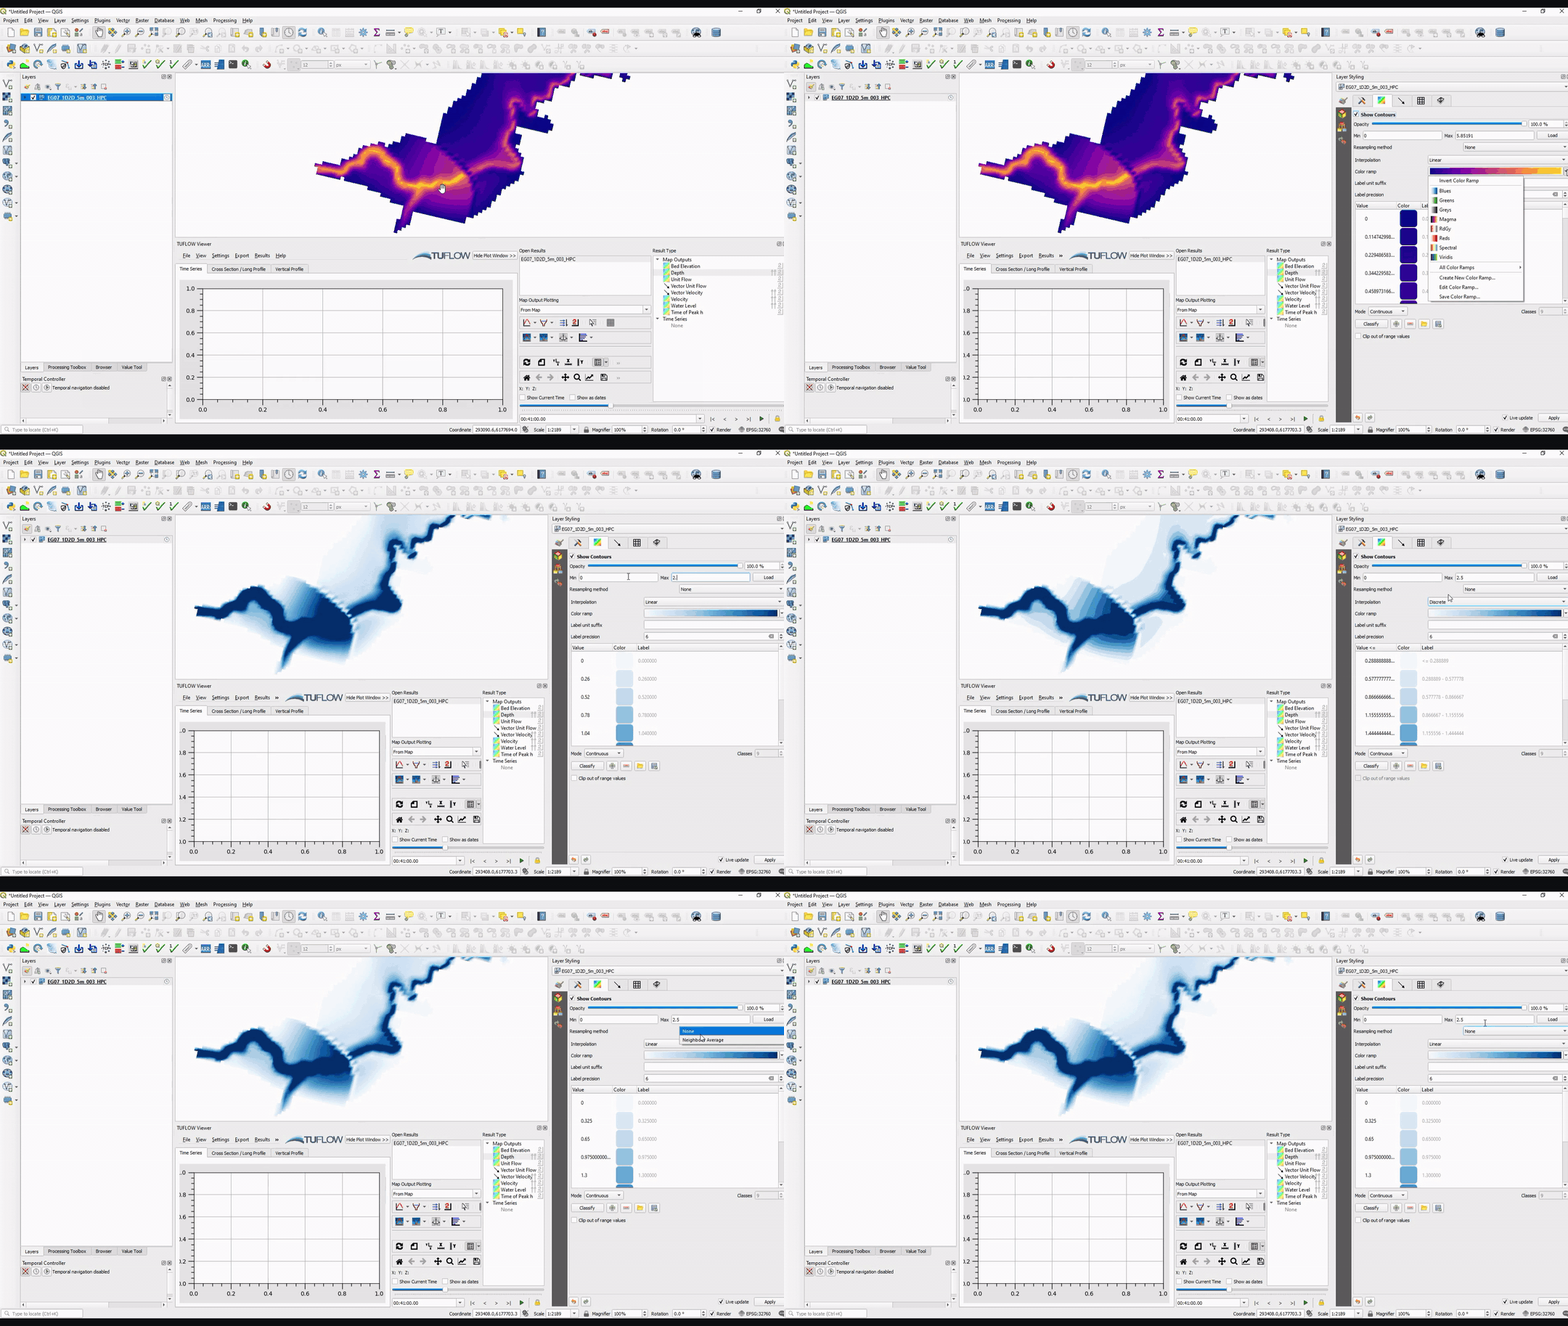
Scalar map output types can be styled in a very similar way as raster layers in QGIS. This can be done via right clicking the mesh layer in the Layers Panel then selecting "Properties", or pressing F7 to open the properties dock window. The properties dialog can also be opened by right clicking the result type in TUFLOW Viewer and selecting "Properties".
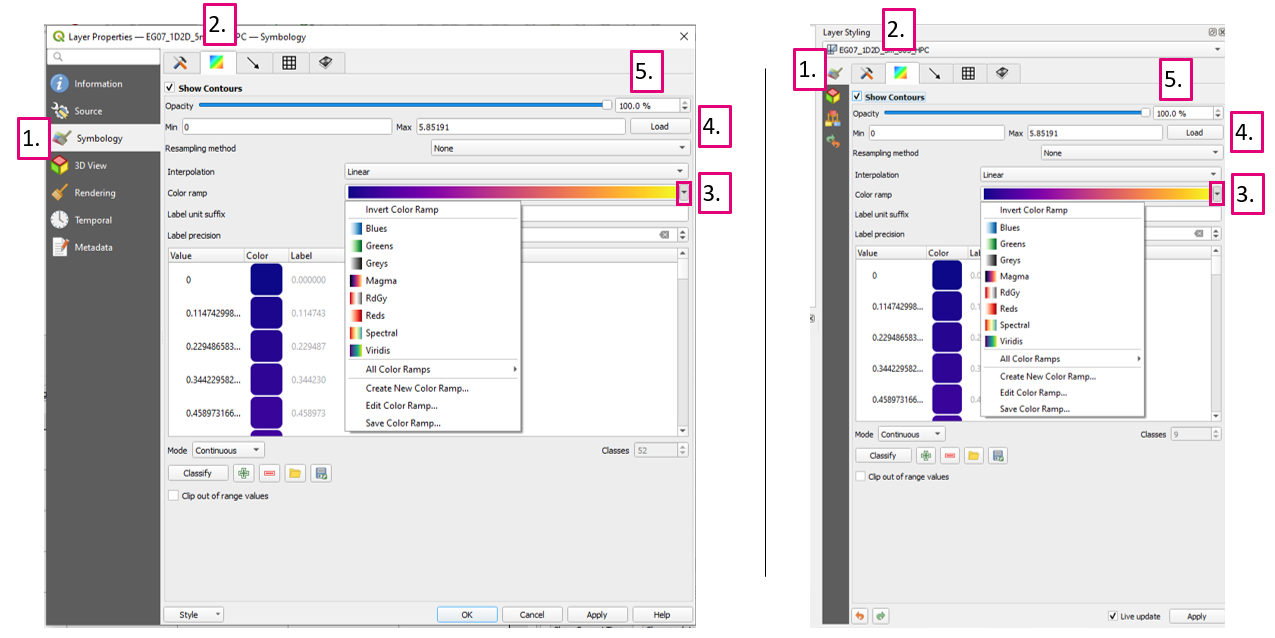
The below image shows both the properties dialog and properties docking window. The key layout difference for styling scalar result types is where the "Symbology" tab (1) is located on the left-hand side. The rest of the key options are identical between the two methods.
Scalar Styling Properties:
- Symbology tab - where the styling options are located in the properties dialog/docking window.
- Scalar styling tab - where the scalar type properties are defined.
- Colour ramp selection - use the down arrow indicated to choose a pre-defined colour ramp option.
- Use the "Load" button to load the min/max values of the current dataset (temporal results will pull the min/max values from all timesteps). Alternatively users can define their own min/max values.
- Set the result type opacity by setting the value explicitly or by using the slider.
Examples
- Change Simulation Result Selection
- Change Result Type Selection
- Display Result Maximum
- Display Vectors
- Style Vector Map Outputs
- Save Default Styles
- Display The Mesh
- 3D to 2D Depth Averaging
- Toggling Between Output Timesteps
| Up |
|---|

