TUFLOW SWMM Tutorial M03: Difference between revisions
| Line 363: | Line 363: | ||
<u>[[TUFLOW_SWMM_Tutorial_M03_Results_QGIS | TUFLOW SWMM Tutorial 03 Results]]</u> <br> |
<u>[[TUFLOW_SWMM_Tutorial_M03_Results_QGIS | TUFLOW SWMM Tutorial 03 Results]]</u> <br> |
||
==SWMM.rpt Output== |
|||
The SWMM simulation report can be opened using a text editor to review the 1D SWMM hydrology results. |
|||
<ol> |
|||
<li>In File Explorer, navigate to '''TUFLOW\results''' and open '''TS01_5m_001_swmm.rpt''' in Notepad++. |
|||
<li>Type Ctrl+F to display the "Find" options in Notepad++. |
|||
<li>Search for "Subcatchment Time Series Results" to navigate to the subcatchment hydrology results in tabular format. The QGIS Result Viewing section below demonstrates how to view the same timeseries data in QGIS. |
|||
</ol> |
|||
Since the above tasks were demonstrated in <u>[[TUFLOW_SWMM_Tutorial_M02_Check_QGIS |Tutorial 2]]</u>, a video of these steps has not been created. |
|||
==QGIS Result Viewing== |
|||
<ol> |
|||
<li>Open TUFLOW Viewer from the TUFLOW Plugin toolbar.<br> |
|||
<br> |
|||
[[File:tuflow_plugin_tuflow_viewer.png]]<br> |
|||
<br> |
|||
<li> Open 1D and 2D results: Select File > 'Load Results'. Navigate to the '''TUFLOW\runs''' folder and select '''TS01_5m_001.tcf'''. |
|||
<li> When asked 'Do you want to open result GIS layer?', select 'Yes'. Five new files will load to the Layers panel: |
|||
:*'''TS03_5m_001_swmm_ts_P''': 1D SWMM Node and outlet water level results |
|||
:*'''TS03_5m_001_swmm_ts_L''': 1D SWMM conduit flow results |
|||
:*'''TS03_5m_001_PLOT_P''': 1D ESTRY and 2D plot output water level and velocity results ('''Note:''' There are no ESTRY results from this simulation) |
|||
:*'''TS03_5m_001_PLOT_L''': 1D ESTRY and 2D plot output flow results ('''Note:''' There are no ESTRY results from this simulation) |
|||
:*'''TS03_5m_001''': 2D TUFLOW results |
|||
<li>In the QGIS Layers panel, select (left click) '''TS03_5m_001''' to establish it as the active dataset. Click on a scalar dataset 'Depth' under the Result Type in the TUFLOW Viewer 'Map Outputs' list. Move the time slider to observe how the 2D results vary at different times during the simulation.<br> |
|||
<li>In the QGIS Layers Panel, left click '''TS03_5m_001_swmm_ts_P''' and select 'Zoom to Layer(s)'. |
|||
<li>Right click '''TS03_5m_001_swmm_ts_P''' again, and select 'Show Labels'. |
|||
<li>Use the 'Select Features' tool to highlight '''Pit 19''' and view the following results using the Time Series plot. |
|||
* '''Lateral Inflow''': SWMM hydrology subcatchment inflow |
|||
* '''Flood Losses''': Water passing through the pipe inlet (a positive value represents surcharge to the surface) |
|||
<li> Pipe flow and long-section results can also be viewed following the steps outlined in <u>[[TUFLOW_SWMM_Tutorial_M02_Results_QGIS |Tutorial 2]]</u>. |
|||
</ol> |
|||
<br> |
|||
'''<<Video>>''' |
|||
<br> |
|||
= Conclusion = |
= Conclusion = |
||
Revision as of 11:34, 18 January 2024
Introduction
This tutorial, Module 3 of the TUFLOW SWMM tutorial dataset, demonstrates how to add SWMM urban hydrology to a 1D / 2D SWMM stormwater pipe network / 2D TUFLOW HPC catchment model. TUFLOW SWMM Tutorial Module 3 builds from the model created in TUFLOW SWMM Tutorial Module 2. The completed TUFLOW SWMM Module 2 model is provided in the TUFLOW_SWMM_Module_03\TUFLOW folder of the download dataset as the starting point for this tutorial. If you are not already familiar with TUFLOW SWMM linking, we recommend first completing Module 1 and 2 before this tutorial.
Project Initialization
QGIS
QGIS Version 3.34 or newer, and QGIS TUFLOW Plugin 3.9.0.49 or newer are required to access the SWMM Processing Tools described in the following sections. For installation, see Installation of TUFLOW Plugin.
Define the Coordinate Reference System (CRS), also called ‘Projection’, for the QGIS workspace:
- Open QGIS.
- Go to Project > Properties…
- In the CRS tab, type ‘WGS 84 / UTM Zone 60S’.
- Select the matching projection in the 'Predefined Coordinate Reference Systems' section.
- Click ‘Apply’ and ‘OK’.
- Ensure that the projection is set correctly by viewing the bottom right hand corner of the workspace. It should read ‘EPSG:32760’.
TUFLOW Plugin
Next we need to configure the QGIS TUFLOW Plugin settings to link with the project folder where we will build our model:
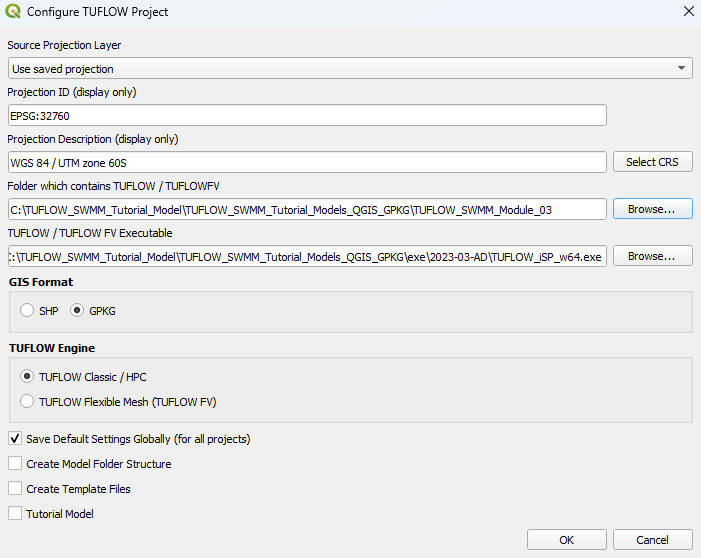
- Open the 'Configure TUFLOW Project' tool by selecting Plugins > TUFLOW > Editing > Configure / Create TUFLOW Project.
- In the previous section, the CRS (Coordinate Reference System) for the QGIS Workspace was defined. As such, the projection inputs are set automatically.
- To set the location of the TUFLOW folder, click 'Browse...' and navigate to the TUFLOW_SWMM_Module_03. Click 'Select Folder'.
- To set the location of the TUFLOW single precision executable file, click 'Browse...' and navigate to the exe\2023-03-AD folder. Select TUFLOW_iSP_w64.exe and click 'Open'.
- Select 'GPKG' as the GIS Format.
- Select 'TUFLOW Classic / HPC' as the TUFLOW Engine.
- Tick on 'Save Default Settings Globally'.
- Click 'OK'.

TUFLOW Model
Load and Style TUFLOW Model Files
Load in the project GIS layers:
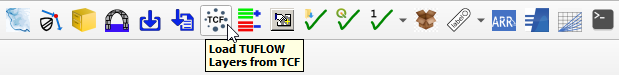
- Click on the ‘Load TUFLOW Layers from TCF’ symbol from the TUFLOW Plugin toolbar.
- In File Explorer, navigate to the TUFLOW_SWMM_Module_03\TUFLOW\runs folder and select TS02_5m_001.tcf.
- In the Load Layers window, select:
- Ordering Options: Alphabetical
- Grouping Options: Group by control file
- Raster Load Options: Load Normally
- Click ‘Open’ and ‘OK’.

Style the TUFLOW layers. Suggested styling steps were provided in TUFLOW SWMM Tutorial M01. They have not been duplicated here.
Increment TUFLOW GeoPackage File
Save a copy of TS02_001.gpkg with a new name, TS03_001.gpkg. This project initialization step is recommended so prior model versions from a project are not broken as a result of changes being made to GIS inputs.
- In the QGIS Layers Panel, select (left click) 2d_bc_M01_001_L.
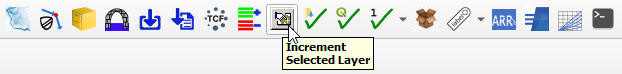
- Click on the 'Increment Selected Layer' symbol from the TUFLOW Plugin toolbar. This opens the dialog shown below.
- Source Layer: Automatically set to the selected layer, 2d_bc_M01_001_L.
- Output Database: Click 'Browse...'. This will automatically open to the TUFLOW\model\gis folder. Set the new output database name to TS03_001.gpkg and click 'Save'.
- Output Layer Name: This was automatically incremented to, 2d_bc_M01_002_L. Change the value to 2d_bc_M01_001_L.
- Delete the pre-filled 'Incremented Layer' entry in the table. We do not wish to modify the version number associated with the 2d_bc file. This current exercise will not change the version number of any of the GIS layer inputs, it is simply establishing a copy of the existing GeoPackage where future edits will be saved to.
- Select 'Remove Source Layer from Workspace'.
- Select 'Increment Layer and Preserve Database'.
- Click 'OK'.

Increment SWMM GeoPackage File
SWMM pipe network junction attributes need to be updated when converting a TUFLOW 2D direct rainfall / SWMM 1D model (Module 2) into a format that uses SWMM hydrology instead of direct rainfall. Similar to above (incrementing the TUFLOW GeoPackage file), we will increment the SWMM pipe network database name so we do not alter the inputs necessary for TS03_5m_001.tcf to function without issue.
- Left click sw02_001 in the QGIS Layers panel.
- Waiting for Rusty's SWMM Increment Selected Layer tool.
- Set the new Database name to sw03_001.gpkg
- Select OK.
Save QGIS Project Workspace
Save the QGIS Workspace:
- Go to Project > Save As.
- Navigate to the TUFLOW_SWMM_Module_03 folder and type SWMM_M03 as the filename with the extension .qgz.
GIS Inputs
Update SWMM GeoPackage Spatial Database
In previous tutorials we have created new SWMM GeoPackage databases for our new entries. This tutorial will demonstrate a different update approach. Instead of creating a new SWMM GeoPackage database, we will update the existing database, sw03_001.gpkg by adding new SWMM Sections for the hydrology elements we will be incorporating into the model in this tutorial.
- Go to Processing > Toolbox from the top dropdown menu options to open the Processing Toolbox.
- Go to TUFLOW > SWMM in the processing tool list and select 'GeoPackage - Add sections'. This opens the dialog shown below.
- GPKG filename modify: Click the ... and navigate to the TUFLOW_SWMM_Module_03\TUFLOW\model\swmm folder. Select sw03_001.gpkg.
- CRS for GeoPackage: Click the drop down menu and select 'Project CRS: EPSG:32760 - WGS 84 / UTM zone 60S'.
- SWMM Sections to add: Click the ..., and tick on:
- Hydrology--Raingages
- Hydrology--Subcatchments
- Click 'Run'.
The above steps have added the new sections to the SWMM GeoPackage database, sw03_001.gpkg. However, the new sections are not currently displayed in the QGIS Layers Panel. We need to close the database and reopen it to view the changes.
- In the QGIS Layers Panel, right click sw03_001 and select 'Remove Group...'.
- In File Explorer, navigate to the TUFLOW\model\swmm folder and drag and drop sw03_001.gpkg into QGIS.
- When prompted by QGIS, under 'Options', tick on 'Add layers to group', then select 'Add Layers' to open all vectors within sw03_001.gpkg. By default, all items in the available list should have been selected.
- In the QGIS Layers Panel, move sw03_001.gpkg to the top of the list. This will ensure the data within this database file is displayed above all other layers in the project when we are making edits.
SWMM GIS Data Entry
A GeoPackage called Urban_Hydrology.gpkg is provided in the TUFLOW_SWMM_Module_03\Tutorial_Data folder. It contains one SWMM input layer and one TUFLOW input layer:
- SWMM_Subcatchments: defines the 1D SWMM urban hydrology subcatchment delineation and associated parameters.
- TUFLOW_Subcatchments: defines the remaining 2D TUFLOW catchment hydrology subcatchment delineation.
To populate the SWMM GeoPackage created in the previous section:
- In Windows Explorer, navigate to the TUFLOW_SWMM_Module_03\Tutorial_Data folder. Drag and drop the Urban_Hydrology.gpkg into QGIS.
- When prompted by QGIS select SWMM_Subcatchments. Click 'Add Layers'.
- In the QGIS Layers Panel, right click on the SWMM_Subcatchments layer and select 'Zoom to Layer'.
- Use the 'Select Features' tool to highlight all items included in SWMM_Subcatchments.
- Select 'Edit' from the top QGIS tab and 'Copy Features' from the drop down menu.
- In the QGIS Layers Panle, select (left click) the sw03_001 >> Hydrology--Subcatchments layer.
- Make the sw03_001 >> Hydrology--Subcatchments layer editable by clicking the 'Toggle Editing' symbol
 .
.
- Select 'Edit' from the top QGIS tab and click 'Paste Features' from the drop down menu.
- Toggle the editing off to save the edits.
- Remove SWMM_Subcatchments.
SWMM GIS Data Updates
The following updates are being made to the objects and layers within sw03_001.gpkg.
Update SWMM Hydrology Raingages
The information within Hydrology--Raingage defines the pluviographs in the catchment. We will link to two different rain gages in this example.
Note: 'Gage' is the American spelling of 'Gauge' in Oxford English.
- In the QGIS Layers Panel, select (left click) Hydrology--Raingage and toggle on editing.
- Right click Hydrology--Raingage and select 'Open Attribute Table'.
- Click 'Add Feature'. Enter the following attributes (leave all other fields as NULL):
Name Form Intevl SnowCatchDeficiency Format Tseries RF_G1 Volume 0.15 1 TIMESERIES RF_FC04 RF_G2 Volume 0.15 1 TIMESERIES RF_FC07 For a summary of the attributes associated with Hydrology--Raingage, refer to TUFLOW 2023-03-AD Release Notes (Table A.11) and the SWMM5 Reference Manual - Volume 1 (Hydrology).
- Turn off editing and save the information.
Update SWMM Hydrology Subcatchments
The information within Hydrology--Subcatchments defines the subcatchment parameters (including catchment area, width, slope, percent impervious, outlet specification and infiltration details). All required data entries have been pre-filled in the supplied dataset except the 'Area' information. SWMM requires the hydrology subcatchment area information in hectares.
- In the QGIS Layers Panel, select (left click) Hydrology--Subcatchments and toggle on editing.
- Right click Hydrology--Subcatchments and select 'Open Attribute Table'.
- Choose 'Area' as the target field and type the calculation expression, $area / 10000.
- Click Update All.
- Turn off editing and save the information.
- Inspect the attribute information within Hydrology--Subcatchments to familiarize yourself with the data. A few demonstration features have been included in the dataset.
- Two rainfall gages are linked to the subcatchments. Downstream subcatchments linked to rain gage 'RF_G1'. Upstream subcatchments are linked to rain gage 'RF_G2'.
- Subcatchments 'SPit11A' and 'SPit11A' are being routed to subcatchment 'SPit11C' before entering the SWMM pipe network. All other hydrology subcatchments route directly to a SWMM Node--Junctions.
SWMM Options
SWMM Project--Options defines the SWMM simulation controls, such as hydrology computation timestep. Project--Options are not required in the new GeoPackage database we are creating for this Tutorial. This is because this model will be constructed from multiple SWMM input (INP) files:
- sw01_001.inp (road culverts).
- sw03_001.inp (underground pipe network inputs and SWMM hydrology).
When TUFLOW processes SWMM inputs, it combines the multiple INP files into one single INP prior to simulation. For this model, the simulation control parameters defined in Module 1 (sw01_001) Project--Options will apply. The options relevant to this tutorial that have already been defined in the Module 1 input include:
- flow_units: set to metric.
- infiltration method: set to Green Ampt.
- wetstep hydrology timestep: set to 1 minute.
- dry step hydrology timestep: set to 1 minute.
Note: If we wanted to change the Project--Options as a result of this modules additional data, Project--Options should have been included as a item in the earlier SWMM GeoPackage Update step, or SWMM GeoPackage Create step if using the model development workflow demonstrated in the previous tutorials. If the SWMM INP file reference is specified lower in the TCSF control file, the information contained in the file supersedes any duplicate information defined by INP files higher in the TCSF control file .
Update SWMM Junction Details
When coupling SWMM hydrology with a 1D pipe network, updated Nodes--Junctions attribute details are needed if converting from 2D direct rainfall (rain-on-grid) model design. Now the SWMM hydrology inputs are complete, we will make the necessary changes to Nodes--Junctions in sw03_001.gpkg.
- In the QGIS Layers Panel, select (left click) Nodes--Junctions and toggle on editing.
- In the Processing Toolbox, select the 'Edit Features In-Place' tool. This allows the editing of an existing layer, instead of the creation of a new layer.
- Go to TUFLOW > SWMM in the processing tool list and select 'Junctions - Set attributes ' processing tool. This opens the dialog shown below.
- Input Subcatchments: Hydrology--Subcatchments
- Input Inlet Usage Layers: swmm_iu_TS02_001
- Input BC Connection Layers: 2d_bc_SWMM_Pipe_Network_Connections_001_L
- Maximum Depth Option: Set to 0.0
- Nodes receiving subcatchment flows (if connected to 2D): Set Apond = 0.0; Ksur = 0.0 (overwrites options below)
- Nodes connected to 2D with Inlets (Maximum depth): Use global option
- Nodes connected to 2D with Inlets (Ysur): 0
- Nodes connected to 2D with Inlets (Area of ponding): 25
- Nodes connected to 2D without Inlets (Ysur): 0
- Nodes connected to 2D without Inlets (Area of ponding): 50
- Nodes without 2D Connection (Surcharge Depth): 50
- Nodes without 2D Connection (Area of ponding): 1
- Select 'Modify All Features'.
- Once the tool has finished, click 'Close'.
- Turn off editing to save the edits.
- View the attributes associated within Nodes--Junctions to verify the data processing has been completed correctly.
For a summary of the attributes associated with the Nodes--Junctions layer, refer to TUFLOW 2023-03-AD Release Notes (Table A.30) and the SWMM Reference Manual - Volume 2 (Hydraulics).
Export SWMM INP File
We will now create a new INP file for the pipe network and SWMM urban hydrology inputs. To do this, we need to convert sw03_001.gpkg into a SWMM INP file.
- In the Processing Toolbox, go to TUFLOW > SWMM and select 'GeoPackage - Write to SWMM inp'. This opens the dialog shown below.
- GeoPackage Input File: Navigate to the TUFLOW\model\swmm folder and select sw03_001.gpkg.
- By default, this tool will save the SWMM inp file in the same folder location and with the same name as the GeoPackage input file. In this case, it will save sw03_001.inp to the TUFLOW\model\swmm folder.
- Click 'Run'.
- Once the tool is finished, click 'Close'.
TUFLOW GIS Updates
We will be reverting the TUFLOW model back to a configuration that uses inflows from an external hydrology model (as per Module 1), instead of 2D direct rainfall (Module 2), in the areas not covered by SWMM urban hydrology. Instead of reusing the input from Module 1, we will need to use a new TUFLOW source area inflow layer. This will ensure that we do not double count the flow generated over the area now represented by SWMM.
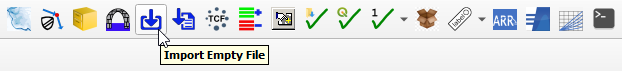
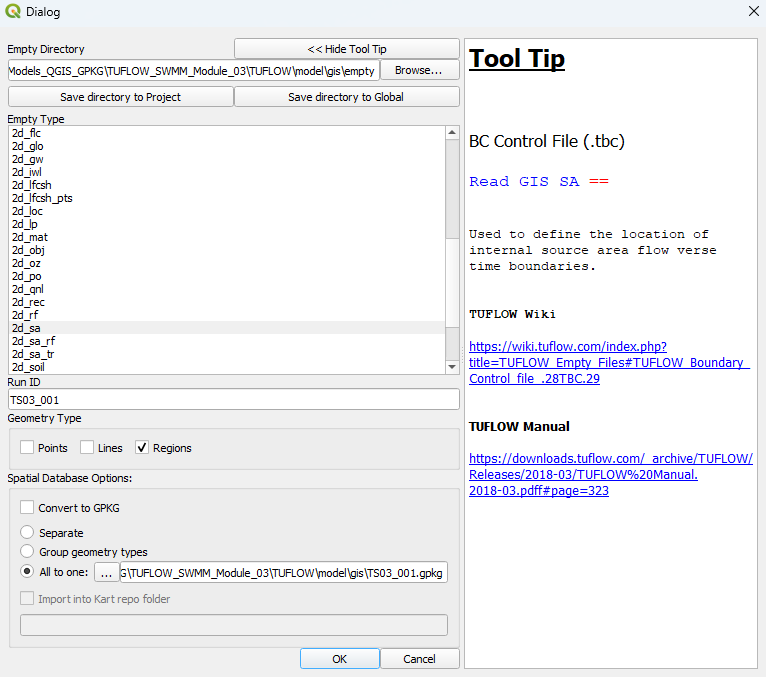
- Click on the ‘Import Empty File’ symbol from the TUFLOW plugin toolbar.
- Select '2d_sa' from the Empty Type list.
- In the Run ID box write 'TS03_001'.
- Tick the 'Regions' Geometry Type.
- In the Spatial Database Options, select 'All to one'. Navigate to the TUFLOW_SWMM_Module_03\TUFLOW\model\gis folder and select TS03_001.gpkg. Click Save and hit 'OK'.
- The 2d_sa_TS03_001_L appears in the QGIS Layers Panel.
- In Windows Explorer, navigate to the TUFLOW_SWMM_Module_03\Tutorial_Data folder. Drag and drop the Urban_Hydrology.gpkg into QGIS.
- When prompted by QGIS, select TUFLOW_Subcatchments. Click 'Add Layers'.
- In the QGIS Layers Panel, select (left click) the TUFLOW_Subcatchments layer.
- Use the 'Select Features' tool to highlight the four regions included in TUFLOW_Subcatchments.
- Select 'Edit' from the top QGIS tab and 'Copy Features' from the drop down menu.
- In the QGIS Layers Panel, select (left click) the 2d_sa_TS03_001_R layer.
- Select 'Edit' from the top QGIS tab and click 'Paste Features' from the drop down menu.
- Toggle off editing to save the edits.
- Remove Urban_Hydrology.gpkg.
The polygon entry we have updated refers to a new subcatchment name for the region adjacent to the SWMM subcatchments. The new name is 'FC06.62', instead of 'FC06'. When we update the TUFLOW Control files we will configure the file references so we are sourcing data from a new flow file obtained from an external hydrology model that has been updated with the reduced catchment area, in recognition of SWMM being used for the flow estimate in the proposed urban development area.
Note: Common hydrology software used in combination with TUFLOW by modelers include: HEC-HMS, RORB, Drains, WBNM, URBS and more.
TUFLOW Boundary Updates
As a result of the changes made to the TUFLOW inflows, new TUFLOW Boundary Condition csv files are also needed. Updated files have been provided in the TUFLOW_SWMM_Module_03\Tutorial_Data folder. These files provide the values and model linkages to the new hydrology inflows, which include the 'FC06.62' entry.
- Copy bc_dbase_TS03_001.csv and TS03_01p2hr.csv from the TUFLOW_SWMM_Module_03\Tutorial_Data folder to the TUFLOW_SWMM_Module_03\TUFLOW\bc_dbase folder.
Simulation Control Files
To avoid the potential risk of overwriting existing control files accidentally, we will start by saving new control files where we will be making subsequent syntax updates during the following steps.
- Open TS02_5m_001.tcf in a Text Editor (Notepad++ is recommended). Save the file as TS03_5m_001.tcf in the TUFLOW_SWMM_Module_03\TUFLOW\runs folder.
- Using the 'Open File' function in Notepad++:
- Open TS02_001.tbc, and save the file as TS03_001.tbc in the TUFLOW\model folder.
- Open TS02_001.tscf, and save the file as TS03_001.tscf in the TUFLOW\model folder.
TUFLOW Control File (TCF)
- Open TS03_001.tcf.
- Make the following reference updates:
Spatial Database == ..\model\gis\TS03_001.gpkg ! Specify the location of the GeoPackage Spatial Database
BC Control File == ..\model\TS03_001.tbc ! Reference the TUFLOW Boundary Condition Control File
BC Database == ..\bc_dbase\bc_dbase_TS03_001.csv ! Reference the Boundary Condition Database
SWMM Control File == ..\model\TS03_001.tscf ! Reference the SWMM (1D) Control File
- Comment out the 'Map Cuttoff Depth' command by placing a '!' at the beginning of the line. This command is only necessary for 2D direct rainfall (rain on grid) modelling (SWMM Tutorial 2).
! Map Cutoff Depth == 0.05
TUFLOW Boundary Control File (TBC)
- Open TS03_001.tbc. If using Notepad++, right click the file reference in TS03_5m_001.tcf and select 'Open File'.
- Comment out the 'Global Rainfall BC' command by placing a '!' at the beginning of the line. This command is only necessary for 2D direct rainfall (rain on grid) modelling (SWMM Tutorial 2).
! Global Rainfall BC == RF_FC04
- Add the following additional command:
Read GIS SA == 2d_sa_TS03_001_R ! Reads in 2D source area - Excluding SWMM areas
TUFLOW SWMM Control File (TSCF)
- Open TS03_001.tscf. If using Notepad++, right click the file reference in TS03_5m_001.tcf and select 'Open File'.
- Replace Read SWMM == swmm\sw02_002.inp with the following command:
Read SWMM == swmm\sw03_001.inp
- Add the following additional command:
Read BC Timeseries == RF_FC04 | RF_FC07 ! TUFLOW BC Database / SWMM Rain Gage Linkage
Running the Simulation
- Save a copy of _run_TS02_HPC.bat as _run_TS03_HPC.bat in the TUFLOW_SWMM_Module_03\TUFLOW\runs folder.
- Update the batch file to reference the TS03_5m_001.tcf :
set exe="..\..\..\exe\2023-03-AD\TUFLOW_iSP_w64.exe"
set run=start "TUFLOW" /wait %exe% -b
%run% TS03_5m_001.tcf - Double click the batch file in Windows Explorer to run the simulation.
If the model simulation doesn't run, here is a link to some common Trouble Shooting advice.
Troubleshooting
Did your TUFLOW SWMM model fail to run successfully? If so, here is a link to a troubleshooting guide: TUFLOW SWMM Troubleshooting.
Check Files
Review the SWMM INP and simulation report file from the TUFLOW_SWMM_Module_03\TUFLOW\results folder to confirm the new hydrology inputs are being processed correctly:
- View TS03_5m_001_swmm.inp in a text editor to confirm the combining of the two input INP files has occurred correctly. Also use the QGIS Processing tool, GeoPackage - Create from SWMM inp , to view the information in QGIS.
- View TS03_5m_001_swmm_curves.inp in a text editor to confirm the rainfall time series that has been used by the SWMM hydrology engine matches the input dataset.
- View TS03_5m_001_swmm.rpt in a text editor to confirm the model computation is healthy in term of mass conservation.
Results Output
Complete the steps outlined in following link to review the simulation results from the TUFLOW SWMM model simulation:
TUFLOW SWMM Tutorial 03 Results
Conclusion
- EPA SWMM urban hydrology was added to the model (replacing 2D drect rainfall / rain-on-grid)
- The 1D SWMM pipe urban pipe network junction attributes were updated to accomodate for the change in model configuration, from 2D direct rainfall to 1D SWMM hydrology.
- Check and result files associated with the SWMM hydrology modelling were inspected.
| Up |
|---|