TUFLOW Viewer - Summary of Plotting Toolbar
Tool Description
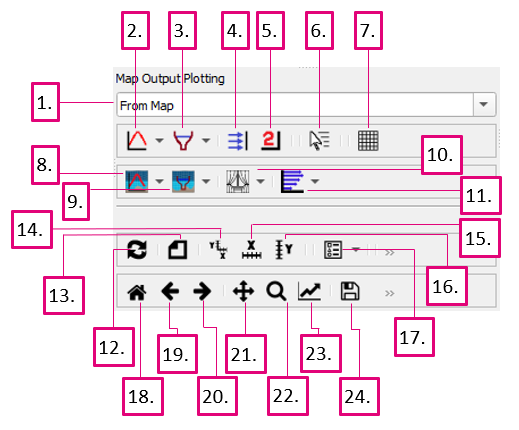
- Location Selection Box - Changes the method of choosing the location to extract plotting information from – either from the map at the time of plotting, or from a pre-existing feature in a vector layer
- Plot Time Series from Map Output - Plots a time series from a single point from the map output results
- Plot Cross Section from Map Output - Plots a cross section from a polyline from the map output results at the current timestep
- Plot Flux from Map Output - Plots flux (flow) from a polyline from the map output results
- Flux Plot Secondary Axis - Places the flux that has been plotted, or will be plotted, onto the secondary axis
- Live Cursor Tracking - Toggles live cursor tracking when plotting
- Toggle Mesh Rendering - Toggles mesh rendering for the map outputs
- 3D to 2D Averaging Time Series - Plots a time series from a single point from the map output results using specified depth averaging methods (used for 3D map outputs)
- 3D tp 2D Averaging Cross Section - Plots a cross section from a polyline from the map output results at the current timestep using specified depth averaging methods (used for 3D map outputs)
- Curtain Plot - Plots curtain from a polyline from the map output results at the current timestep
- Vertical Profile - Plots profile vertically down the water column from a single point at the current timestep (used for 3D map outputs)
- Refresh Current Plot - Refreshes the current plot by recalculating plot items
- Clear Current Plot - Clears the current plot
- Freeze Axis Limits - Locks the X and Y axis limits to the current values
- Freeze X-Axis Limits - Locks the X axis limits to the current values (will be applied to a secondary X axis if one is present)
- Freeze Y-Axis Limits - Locks the Y axis limits to the current values (will be applied to a secondary Y axis if one is present)
- Legend - Toggle legend and set legend settings
- Reset Original View - Will reset extents to original view
- Previous View - Will reset plot extents to previous view
- Next View - Will reset plot extents to next view
- Pan Axes - Allow user to interactively change plot extents by panning
- Zoom - Allow user to interactively change plot extents by zooming to a rectangle
- Customize - Opens up plot customisation options
- Save - Export plot as image
Examples
Please use the links at the bottom of the page to find more details and relevant examples.
Links
Similar Tools
- Map Output - Plotting Time Series
- Map Output - Plotting Cross-Sections and Longitudinal Profiles
- Map Output - Plotting Flow
- Live Cursor Tracking
- Display The Mesh
- Map Output - Plotting 3D to 2D Depth Averaged Time Series
- Map Output - Plotting 3D to 2D Depth Averaged Cross-Sections
- Map Output - Curtain Plot
- Map Output - Vertical Profile
- Customising The Legend
- Customising The Plotting Styles
- Customising The Plot Axes
- Navigating And Querying The Plot
